
SLIDE 1
EEC Q2 Investor Presentation DI DISCLAIM IMER ER This - - PowerPoint PPT Presentation
EEC Q2 Investor Presentation DI DISCLAIM IMER ER This presentation (Presentation) has been prepared by Emaar the Economic City (EEC) and/or its subsidiaries based on information available to it internally and third party sources. This
third party sources. This Presentation does not purport to contain all the information that a prospective investor may require in connection with any potential investment in EEC. You should not treat the contents of this Presentation, or any information provided in connection with it, as financial advice, financial product advice or advice relating to legal, taxation or investment matters. No representation or warranty is made by EEC or any of its advisers, agents or employees as to the accuracy, completeness or reasonableness of the information in this Presentation or provided in connection with it. No information, including but not limited to numbers, maps, drawings, or maps contained in this Presentation or any other written or oral communication in connection with it is, or shall be relied upon as, a promise or representation and no representation or warranty is made as to the accuracy or attainability of any estimates, forecasts or projections set out in this
for any loss or damage suffered or incurred by you or any other person or entity however caused (including, without limitation, negligence) relating in any way to this Presentation including, without limitation, the information contained in or provided in connection with it, any errors or omissions from it however caused (including without limitation, where caused by third parties), lack of accuracy, completeness, currency or reliability or you, or any other person or entity, placing any reliance on this Presentation, its accuracy, completeness, currency or reliability. EEC does not accept any responsibility to inform you of any matter arising or coming to EEC’s notice after the date of this Presentation which may affect any matter referred to in this Presentation. Any liability of EEC, their advisers, agents and employees to you or to any other person or entity arising out of this Presentation including pursuant to any applicable Saudi law is, to the maximum extent permitted by law, expressly disclaimed and excluded.
and any other persons who come into possession of this Presentation must inform themselves about, and observe any such restrictions.
strategy and prospects may or may not be achieved. They are based on certain assumptions, which may not be met or on which views may differ and may be affected by known and unknown risks. The performance and operations of EEC may be influenced by a number of factors, many of which are outside the control of
expectations or plans will be achieved either totally or partially or that any particular rate of return will be achieved. Given the risks and uncertainties that may cause EEC’s actual future results, performance or achievements to be materially different from those expected, planned or intended, Recipients should not place undue reliance on these intentions, expectations, future plans, strategy and prospects. EEC does not warrant or represent that the actual results, performance or achievements will be as expected, planned or intended.
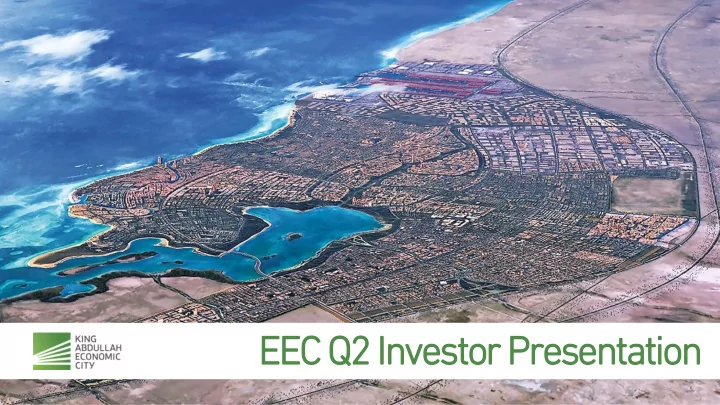
A N New Global bal Hub
Establish King Abdullah Economic City (KAEC) as a strong enabler
Land Use % B Breakdo down wn Land Use Current ent Plan
Industrial 23,625,000 Commercial/Hospitality 12,736,000 Residential 75,373,000 Other er 19,847,000 BUA Total l 131,58 581,000 00 Employment loyment 890,00 000 Popu pula lation tion 1,750, 0,00 000 Industrial 21% Retail 11% Residential 68%
KAEC is a greenfield city development roughly the size of Washington DC. Its objective is to help with Saudi Arabia’s Acute housing demand and support economic diversification. KAEC’s Strategic location
maritime routes and provides instant access to key cities within Saudi Arabia. KAEC is comprised of the Coastal Communities, The Industrial Valley, KAP, and The Hejaz District.
Proje ject Overview view
COMMERCIAL L & LIESURE
CITY DEVELOP LOPMENT NT & ECON ONOM OMIC GROWTH
CITY DRIVE VERS
INFRA-ST STRUCTURE
SOCIAL AMENITIES
HOUSING G NEEDS DS
Land/U d/Unit nit Sale les Debt Shareh ehold
ers s Equ quit ity
Fundin ing g Source ces
Retu turn to Share- holde ders s Fin. . benef efits its to Govt. t. Local l & Foreign eign Inv. . Logistics istics Hub Realizat lizatio ion n of Econom
ic city y vision sion Job Crea eation tion
Econom
ic Impact act
Curren t On Completion
Current nt On Completion letion
132 52
(SARS M)
Revenue Net Income Gross Profit
Q1 2016 Q3 2015
169 85 8.1
Q 4 2015
386 176 158
Q2 2016
230 99.8 79.6
236 147 50
Q2 2015
Net Income of 79.6.2 M SAR for Q2 2016
RD 49% IV 32% Commercial 8% Other Income 11%
% Breakdown of Revenue YTD
Total 364M SARs
Presales and Revenue Segment Breakdown YTD
336 42 179 117 28 39.3 Residential Development Industrial Valley Commercial Development Other Income Presales Revenue 132 52
Financi ncial al Residenti dential l Develo elopm pment ent Indu dust stri rial al Valley Commerc mercia ial l Revenu enue e EBITD TDA Net Profit it
158 117 47 94.7 60 195 28
GP GP
72.9 104
853 1,337 1,202 760 4,152 103 53 98 254 Vertical Land IV Land Sales PDC Land Total Units
Number ber of Units (Full ll Valu lue) Total al Area ea (M2 ‘000)
227 1761 8,711 11,609 22,516 39 55 113
Vertical Land IV Land Sales PDC Land Total Area
Sale les s Valu lue (SAR R M) Reve venue nue (SAR R M)
1,466 2,730 48 2 4,245 35 20 2 363 Vertical Land IV Land Sales PDC Land Total Units PJTD YTD
1,304 2,630 2,377 760 7,496 212 124 42 378
Vertical Land IV Land Sales PDC Land Total SV PJTD YTD PJTD YTD PJTD YTD
Sales GP RE RE Land Vertic ical l
212
NLA Gross s Margin
35
124 54
77,385 5 SQM 459,445 45 SQM
34% 98% (SARS) S)
Revenu enue e
103 55
*60 month ths s of insta tallment nts s for land nd and vertica ical with h a down payment nt of 10% for land nd and 20% for verti tica cal.
Strong ng sales es growth th at 79.95% 5% CAGR from m 2012 2012-2015 2015 driven en by:
demand of over 1M houses to meet market needs.
development segment.
complete
TG4, TG3, TG1.3, GC1c, GC3
volume of sales launches will follow.
Product 2012 2013 2014 2015 Vertical Net Order Intake SAR M 21 9 272 369 Units 12 6 178 641 Land Net Order Intake SAR M 167 673 655 776 Units 136 403 819 912 Totals Net Order Intake SAR M 188 682 927 1,149 Units 148 409 997 1,767
Bench Mark Analysis ysis Jeddah dah vs. KAEC* C*
4,351 3,746 4,807 3,583 5,700 10,160 Affordable Housing Medium Income Housing High Income Housing KAEC Jeddah
*Jeddah Real Estate Prices - Colliers International Market Study *Presales Figures include reservations
% Presales % Unsold % Lease
71% 60% 78% 20% 86% 27% 23% 47% 100% 100% 18% 81% 24%
14% 76% 11% 61% 61%
29% 40% 8% 4% 3% 12% 16% 53% 0% 0% 82% 19% 76% 923 388 116 116 192 192 116 76 5 12 147 179 143 Al Shurooq Al Waha Beach 1 Beach 2 Marina 1 Marina 2 Marina 4 Al Waha BC1 Villa GC1 Villa GC2 Al Talah 1.3 Al Waha Residential Vertical Sales Summary 98% 97% 70% 99% 57% 100% 97% 87% 89% 82% 98% 2% 3% 30% 1% 43% 0% 3% 13% 11% 18% 2% 103 392 155 91 219 145 279 505 410 504 253
BC1 BC2 BC3 GC1 GC3 Al Talah 1.1 Al Talah 1.2 Al Talah 3 Al Talah 4 Al Talah 5 TH4
Residential Land Sales Summary Sold 88% Unsold 12%
%Sold d Land d Sales es
Sold 56% Unsol d 44%
%Sold d Vertic ical al Devel elopmen pment Sales es
New Global bal Hub
Establish King Abdullah Economic City (KAEC) as a strong enabler
Land Use GLA NLA A
IV IA 1,500,000 1,316,000 IV IB 2,100,000 1,816,200 IV Phase 2 22,000,000 17,855,000 IV Phase 3 7,000,000 6,101,000 IV Phase 4 6,440,000* 3,398,000 Bonded Zone 3,000,000* 2,514,000 Northern Parcel 5.400,000* 4,590,000
3% 5% 51% 16% 17% 8% IV IA IV IB IV Phase 2 IV Phase 3
IV Phase 4 Bonded Zone
%IV Break reakdow down n
Phase IV IA Phase IV IB Phase IV 2 Phase IV 3 E&F Industrial Valley NLA Sold Leased
66% 85%
1,316,000 1,862,000 7,000,000S and 6,500,000L 1,214,000
29%
99%
*Rent is collected 1 year in advance and prorated through out the year whereas, sales revenues are recognized immediately in the month of sale.
Phase IV 3 B
44%
900,000
100%
*Rent is collected 1 year in advance and prorated through out the year whereas, sales revenues are recognized immediately in the month of sale.
rring ing revenue nue represe esents nts roughl hly y 40% of IV revenue ues s for Q1 2016
% Growth th in Tenants ants from m 2013-2014 2014 driven en by incr crea ease sed d Port t Act ctivity. vity. RORO hub launch is expected ted in Q4 2016 giving ing the Port rt a capacit ity y of 800,000 000 cars per annum. .
rted re-def efining ning its business iness strategy ategy while e looking king into
tunities ies which ch ma may enhance nce the operati ating g revenue ue such ch as BRZ, wareho housing using, , etc.
ning the creati tion
amic/ ic/Hala alal l Food
de zone e within hin KAEC
stron
g year r for IV seeing eing 17 New Tenants ants 15 of which h executed uted indus ustrial trial lease se agree eeme ments nts and 2 i indus ustri trial l sale e agree eements.
total al amount t of land 324,577 577 and 485,971 971 respec pectiv tively. ely.
gned ed 4 n new lease e agreements ements and one sale agreement ement for total al sqm of 129,050 050 and 113,180 180 sqm respec pectiv tively. ely.
ent t Lease se is SAR 1 16-18 8 / sqm
SqM ‘M