
SLIDE 1
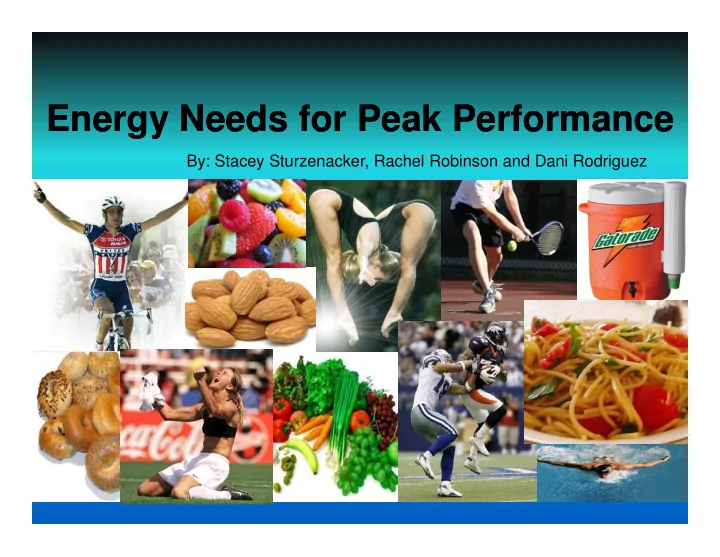
Energy Needs for Peak Performance Energy Needs for Peak Performance
By: Stacey Sturzenacker, Rachel Robinson and Dani Rodriguez
Energy Needs for Peak Performance Energy Needs for Peak Performance - - PowerPoint PPT Presentation
Energy Needs for Peak Performance Energy Needs for Peak Performance By: Stacey Sturzenacker, Rachel Robinson and Dani Rodriguez Objectives Describe what energy is and how it is expressed. Give an overview of the different types of
By: Stacey Sturzenacker, Rachel Robinson and Dani Rodriguez
– Exists in various forms
– Required for
membranes
between energy intake and energy expenditure.
– Weight loss
– Weight gain
performance and ultimately …… winning!!!
– Aspiring soccer athlete – Regularly complains of fatigue and wants to “lean down” – Read various books on nutrition in hopes of finding the ideal diet for her sport. – Learned that fat yields more calories than carbohydrates – Knows that proteins are needed to help muscles recover from training and can be used for energy. – She is convinced that one of the popular high-fat, high protein, low carb diets is best for her
nutrition “experts” to advise them on how to eat: – Athletes in Ancient Greece, consumed dried figs as part of their training diet. – In ancient Olympics, athletes consumed goat meat to give them strength. – At the 1904 and 1908 Olympics, drinking Brandy during a marathon race was a winning strategy .
consume adequate energy to: Maintain body weight
can result in: Loss of muscle mass Menstrual dysfunction Maximize training effects Maintain health Maintain lean tissue mass Loss or failure to gain bone density Increased risk of fatigue, injury, and illness
– Play a vital role in energy provision and exercise performance – Predominant fuel during high-intensity exercise – 4 kcal/g
– Provide structure to all cells in human body – Provide structure to all cells in human body – If deficient, can result in reduced muscle mass, loss of skin elasticity, and thinning – 4 kcal/g
– Important energy source, especially in prolonged exercise – Protect vital organs and fuel most cells – 9 kcal/g
Activity Level Examples of activity level Example of athletes Estimated daily calorie needs (kcal/kg) Sedentary Sitting or standing with little activity During recovery from injury 30 female/31 male Moderate – intensity: exercise 3- 5 days/week Playing tennis, practicing baseball, softball, or golf Baseball players, softball players, golfers, tennis 35 female/ 38 male 5 days/week softball, or golf golfers, tennis players Training several hours/day, most days
Swimming plus some resistance training Swimmers or soccer players 37 female/41 male Rigorous training on a daily basis Training for a triathlon Non-elite triathletes, elite swimmers 40 female/ 45 male Extremely rigorous training Running 15 or more miles/day Elite runners, distance cyclists or triathletes 50 female/ 60 male
Reprinted from Dunford, M (2010), Fundamentals of Sport and Exercise Nutrition.
1st Phosphagen System: – very fast ATP production, very limited (5-10 seconds) – Does not require oxygen – Does not require oxygen – Amount of creatine phsophate is 4 to 6 times greater than amount of ATP stored – Important for fueling short-burst, all-out efforts
2nd Anaerobic Glycolysis System: – fast ATP production (1-2 minutes) – Important for short, high-intensity events – Does not require oxygen – Does not require oxygen – Uses only glucose for fuel – Glucose taken from bloodstream or stored glycogen – Pyruvate is converted to lactic acid, allowing for continuation of anaerobic-glycolytic pathway
3rd Aerobic System: – Slow ATP production (very long duration of energy; minutes to many hours) – Uses stored energy in form of glucose (carbs), – Uses stored energy in form of glucose (carbs), fatty acids (fats), or amino acids (proteins) – Requires adequate oxygen – Two parts: Krebs Cycle and the Electron Transport Chain – Complete aerobic metabolism of a glucose molecule yields ____ ATP molecules. 38
– Soccer – Track and Field – Basketball – Volleyball – Tennis – Football
– First system to tranfer energy and form ATP – Oxygen is not required in this process – Relatively high energy expenditure sport
– Bodybuilding – Soccer – Football – Wrestling – Gymnastics
source of energy
– When a short duration of high intensity is needed.
– Long distance running, swimming, cycling – Marathons – Triathlons
moderate intensity
– When oxygen supply and aerobic ATP production is adequate, fat is used as fuel.
– Energy: Relatively high energy expenditure sport
and competition
healthy fats
– Energy: Must be individually determined, and can be determined if energy needs are low for those trying to reduce body fat and maintain muscle trying to reduce body fat and maintain muscle mass, or high for those to build muscle mass.
healthy fats
– Energy: Relatively high energy expenditure sport, calculated individual needs based on demands of calculated individual needs based on demands of training
during pre-race and racing seasons
– Nutrition needs of athletes change as training changes over the course of the year. – An athlete’s training regimen changes depending – An athlete’s training regimen changes depending if they are in pre-season, competitive season, or post-season
athlete’s energy, and macronutrient needs also change.
distribution must be reevaluated.
– to optimize performance by meeting the nutrient needs depending on physical training – assisting in any health or body composition changes – providing enough energy to meet expenditure.
– Carbohydrates: Depending on training intensity anywhere from 5 to 12 g/kg – Protein:1.2 to 1.7 g/kg – Fat: .8 to 1.0 g/kg
– Carbohydrates: 7 to 13 g/kg – Protein: 1.4 to 2.0 g/kg – Fat: .8 to 1.0 g/kg – Fat: .8 to 1.0 g/kg
– Carbohydrates:7 to 13 g/kg – Protein: 1.4 to 2.0 g/kg – Fat: .8 to 1.0 g/kg
– Carbohydrate need increases during preparation and competition. – Protein need slightly increases during preparation and competition – Fat need remains the same. (Seebohar)
– reproductive health problems – bone health issues like reduction in bone density and – bone health issues like reduction in bone density and stress factors
Photo: http://www.corbisimages.com/Enlargement/42-15313144.html
Karp, J.R., Johnston, J.D., Tecklenburg, S., Mickleborough, T.D., Fly, A.D., and Stager, J.M. (2006). Chocolate Milk as a Post-Exercise Recovery
16:78-91.
http://socialmediaseo.net/author/john-curry/
– To compare chocolate milk to other popular recovery drinks.
– 9 males, highly-trained cyclists – Comparison of chocolate milk, fluid replacement drink (Gatorade), or carbohydate replacement drink (Endurox). (Gatorade), or carbohydate replacement drink (Endurox). – 4 separate training sessions: 4 hours in duration – Initial exercise session and a final glycogen depleting session at 70% VO2max. – Athlete drank supplement directly after workout and 2 hrs post – Comparison of: Time to exhuastion (TTE), average heart rate (HR), rating of perceived exhaustion (RPE), and total work (WT) for the endurance exercise.
– Time to exhaustion and total work were found to be significantly greater for the chocolate milk and the fluid replacement drink as compared to the carbohydrate drink trial.
– Results suggest that chocolate milk
exhausting bouts of exercise.
Study #2: The Effect of High Carbohydrate Meals with Different Glycemic Indices on Recovery of Performance During Prolonged Intermittent High-Intensity Shuttle Running
Erith, S., Williams, C., Stevenson, E., Chamberlain, S., Crews, P., Rushbury, I. (2006). The effect of high carbohydrate meals with different glycemic indices on recovery of performance during prolonged intermittent high-intensity shuttle running. International Journal of Sports Nutrition and Exercise Metabolism. 16, 393-404.
http://www.mujeresnoticia.com/guide-on-carbohydrate.htmc
– Participated in 2 trials in a randomized cross-
high-intensity shuttle running drill
m a g e s p
s 1 h e a
high-intensity shuttle running drill – Consumed a mixed high carbohydrate recovery diet consisting of either high or low GI foods
minute work out that consisted of alternating sprinting and jogging until fatigue.
p w w w b e s u n n n g g a c
Results:
between trails during the day 2 workout.
recovery period did not effect the performance or endurance capacity the following day than a low GI carbohydrate recovery diet.
Discussion: Discussion:
correlation
have an effect on the performance of the athlete
Motonaga, K. Yoshida, S., Yamagami, F., Kawano, T., & Takeda, E. (2006). Estimation of total energy expenditure and its components by monitoring the heart rate of japanese endurace athletes. J Nutr Sci Vitaminol (Tokyo), 52(5), 360. 52(5), 360.
http://4.bp.blogspot.com/_jzv2ZSZAdyU/SY_Q1NNSFOI/AA AAAAAAAek/OOTyExr3x5E/s400/mitsuya.jpg
– 6 Japanese sub-elite endurance runners
11 days – Recording sleep, training, and daily activities – Recording sleep, training, and daily activities
6 and 7:20am and 3:50 and 7:00pm. – Energy Intake
– Proteins- 15% – Fat- 25 to 30% – Carbohydrate- 55 to 60%
http://www.best-running-gear.com/images/polar-rs100-heart-rate-monitor.jpg
Results
the test subjects was higher than was expected.
loss due to the lack of energy provided in the 3,700
loss due to the lack of energy provided in the 3,700 calorie diets.
Discussion:
energy intake of at least 3,000 to 4,500 kcalories and in some instances 5,000 kcalories. As vigorous training increases, energy intake must increase.
Rankin, J.W., Max, S., Heffron, S.P., and Saker, K.E. (2006). Energy restriction but not protein source affects antioxidant capacity in athletes. Free Radical Biology & Medicine, 41:1001-1009.
http://www.healthnewswebsite.com/nutrition/antioxidant_supplements.html
– To examine the effect of energy restriction on antioxidant capacity in trained athletes.
– 20 male cyclists
– Double blind, randomized study for 20 days – Subjects given either whey protein or placebo (casein) – Consumed either whey or placebo (40g/day) in addition to regular diet for 17 days and then underwent energy restriction for final 3 days:
– Kept dietary journal first 3 days and last 3 days – Blood samples drawn on day 14 and 21.
– Energy restriction caused 2.7 ± 0.3 kg weight loss – Increased antioxidants in blood:
– Decreased oxidized GSH (free radical) by 52% – Decreased oxidized GSH (free radical) by 52% – Only immunity factor altered was an increase in phagocytosis 65%.
– Athletes interested??
– There was a negative nitrogen balance found as a result of energy restriction. – Do benefits outweigh the negatives?
Heaney, S., O'Connor, H., Gifford, J. , & Naughton, G. (2010). Comparison of strategies for assessing nutritional adequacy in elite female athletes' dietary intake. International Journal of Sport Nutrition and Exercise Metabolism, 20, 245-256.
http://athletebabes.blogspot.com/2008/01/sabine-lisicki-german-redhead-tennis.html
– To assess if female elite athletes had adequate nutrition based on their dietary assessment of nutrient distribution
– 72 elite female athletes – 72 elite female athletes – Dietary intake evaluated using FFQ – Athletes from various sports – Results compared with Australian nutrient reference values, U.S. military dietary reference intakes, and current sport nutrition recommendations
– Average macronutrient distribution
– Micronutrient distribution met standards except in
– Cyclists and triathletes consumed less energy from fat than volleyball players did. – Mean intake of energy was 10,551 ± 3,836 kJ/day
– Different sports have different energy requirements – Macronutrient intake similar to general population recommendations :
– Reported macronutrient intake not correlated with fueling needs of athlete’s sport – Low intake of CHO can increase fatigue and lower performance.
Theory developed by Urie Bronfenbrenner
Evolving theory that views families and their interactions with the environment Looks at relationships between athlete and their surroundings Encompasses all areas from parents, coaches and friends, to how the wider society influences the individual (culture, media, economic condition, etc.)
– Aspiring collegiate soccer athlete – Wants to follow a popular high-fat, high protein, low carb diet:
diet?
time rely heavily on the anaerobic system along with support from the phosphagen system.
– High fat, high protein diets not appropriate due to: – Fats cannot be metabolized anaerobically – High-fat diets can result in excess calories – Proteins rarely used in short running intervals – Excess protein can lead to excess body fat – Low carb diets do not restore muscle CHO stores between training sessions Best advice we can give Suzie is……..
Balance Moderation Variety
http://www.healthline.com/hlbook/nut-considerations-for-endurance-sports
J Sports Sci, 24(7), 675.
Chicago: American Dietetic Association .
effect of high carbohydrate meals with different glycemic indices on recovery of effect of high carbohydrate meals with different glycemic indices on recovery of performance during prolonged intermittent high-intensity shuttle running. International Journal of Sports Nutrition and Exercise Metabolism. 16, 393-404.
assessing nutritional adequacy in elite female athletes' dietary intake. International Journal of Sport Nutrition and Exercise Metabolism, 20, 245-256.
production and performance. Champaign, IL: Human Kinetics Publishing, Inc.
milk as a post-exercise recovery aid. International Journal of Sport Nutrition & Exercise Metabolism, 16(1), 78-91.
Sports Medicine, 37(4-5), 348-345.
Philadelphia : Saunders.
total daily energy expenditure and its components by monitoring the heart rate of japanese endurance athletes. J Nutr Sci Vitaminol (Tokyo), 52(5), 360.
source affects antioxidant capacity in athletes. Free Radical Biology and Medicine, 41(6), 1001.
http://www.mypyramid.gov