
SLIDE 1
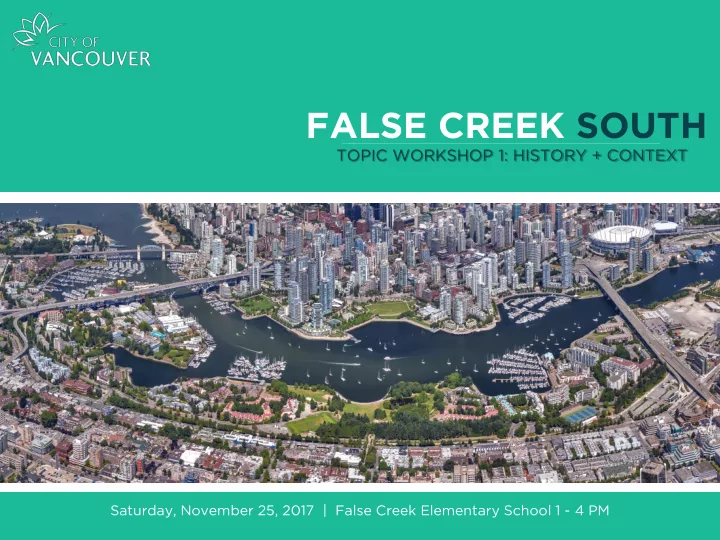
Saturday, November 25, 2017 | False Creek Elementary School 1 - 4 PM
FALSE CREEK SOUTH
TOPIC WORKSHOP 1: HISTORY + CONTEXT
FALSE CREEK SOUTH TOPIC WORKSHOP 1: HISTORY + CONTEXT Saturday, - - PowerPoint PPT Presentation
FALSE CREEK SOUTH TOPIC WORKSHOP 1: HISTORY + CONTEXT Saturday, November 25, 2017 | False Creek Elementary School 1 - 4 PM TODAYS OUTLINE 1. Welc 1. lcome me + I Introd oduct uction ions 2. 2. Backgrou ound nd + R Role of the
Saturday, November 25, 2017 | False Creek Elementary School 1 - 4 PM
TOPIC WORKSHOP 1: HISTORY + CONTEXT
3
6
See False Creek South webpage (www.vancouver.ca/FCS) for complete list of Engagement Principles **
9
10
We Are Here
11
False Creek South Launch: High Level Issues/ Aspirations Workshops: Neighbourhood “Values” & Issues/Ideas July 2018 Update on Directions for Plan Exploration STEP 1: PRINCIPLES + FRAMEWORK MATERIALS ONLINE Summaries from workshops + draft principles / framework Drafting
12
Legend:
False Creek South Study Area My Favorite FCS Big FCS Challenge
14
16
November 25, 2017
The False Creek South area comprises the land between the Cambie and Burrard Street Bridges, situated on the south shore of False Creek, excluding Granville Island and the Squamish Nation lands.
ric Context t Statem emen ent t is a concise narrative document that explores the major thematic events involved in the historical development of an area.
including: geograp aphy hy, First Natio ions ns, industri tries es, planning ng efforts rts, community ty, and characte acter and design.
tic Framework
Statement down into examples of local heritage sites and places of interest, each of which represent one or more of the historic themes.
the curre rent nt and future re planning ing for the area as part
Unique geological, hydrological and climatic events lead to the current form of the False Creek South area, as well as it’s past and present patterns of development.
region.
(ending the Fraser Glaciation).
contemporary plant species in the area.
with life, including deer, elk, beaver, bears, cougars, and a variety of bird and insects
Behind L.A. Hamilton's campsite on the south side of False Creek, 1886, CVA Dist P35
The area’s rich and enduring history spanning more than 10,000 years encompasses deep and complex connections with Northwest Coast First Nation peoples.
shores of False Creek
Creek: sən’a?qw in hən̓q̓əmin̓əm (Musqueam language) and Sen’ákw in Sḵwx̱wú7mesh (Squamish language)
part of a traditional trail network that ran from c̓əsnaʔəm to the foot of Granville Island and then on to sən’a?qw
decline significantly as European exploration activity increase
between 1899 and 1965 residents of the reserve were coerced to leave and land was confiscated
Kitsilano Reserve, circa 1907, CVA 1376-203 Group near Kitsilano Reserve, 1891, CVA In P1.1
False Creek Indian Reserve drawn by original City Archivist Major J.S. Matthews, 1937, CVA MAP 1023
Early industrial development in False Creek South significantly impacted the development of the area as well as the economy and settlement of Vancouver as a whole.
establishment of industry due to easy access to English Bay and the Salish Sea
from sawmills to brick plants; competition for waterside property became intense
Creek was approved; dredging fill from surrounding waters to make Granville Island and much of the FCS neighbourhood
began to decamp to massive suburban industrial parks
Industry on Granville Island (right) and along False Creek South waterfront (left), 1928, CVA Wat N62.1 View of Leamy and Kyle Sawmill looking east from the foot of Ash Street, 1890, CVA Mi P65
Logs in False Creek, circa 1940s, Vancouver Sun Files, courtesy John Mackie
Planning of the area following the industrial era encompassed the post-war boom years to the construction of the seawall in the 1970s.
neighbourhoods was unfathomable due to log booms, sewer discharge, noise from factories, trains, bridges and roads
in the City of Vancouver acquiring nearly all of the waterfront land
development plan was established that featured residential and recreational uses
False Creek South, 1974, CVA 800-0930 False Creek South, 1973, CVA 800-0874
False Creek South with new waterfront seawall, 1975, CVA 800-1324
Participatory community planning methods were employed in the early 1970s in order to ensure a mixture of tenure, income levels, and building/unit styles to be constructed on the site.
community charettes led by architect Stanley King
desire to ensure that the new development was welcoming to a range of residents, including lower income citizens and families
establish Vancouver as a leader in the providing social and market housing located in central areas.
concept of “Vancouverism” promoting the livability of inner-city districts
Island Park Walk along False Creek South, 1986, CVA 775-64 Apartment buildings in False Creek South, 1983, CVA 780-497
Island Park Walk along False Creek South, 1986, CVA 775-64.3
Cohesive building design, with plenty of surrounding green space, townhouse clusters and mid-rise apartment towers represent best-practice building typologies
challenged traditional forms of development
preserved mountain views.
along with the plazas, seawall, and parks, together comprise the village-like atmosphere of the area
contemporary and relevant to best-practice planning schemes of the twenty-first century.
Shoreline Walk, 1983, CVA 780-499
Map of then-proposed enclaves, False Creek Area 6 Proposal, Thompson Berwick, Pratt & Partners, 1972
This chart summarizes the themes and suggests sites in the study area that are representative of the respective themes.
but are meant to provide a starting point for a planning exercise that identifies sites with potential heritage value within the study area.
37
Age, Households + Income
Residential, Commercial, Recreational + Marinas
*Images from False Creek Official Development Plan (1974)
Source: Statistics Canada Census data (Census Tract 0049.02, 2016)
1000 2000 3000 4000 5000 6000 7000 1981 1986 1991 1996 2001 2006 2011 2016
Population Year
**FCS population change lower than Fairview and city- wide average at 3%
44.8% 48.8% 55.9% 61.5% 53.8% 55.3% 51.2% 44.2% 38.6% 46.2% 0% 10% 20% 30% 40% 50% 60% 70% 80% 90% 100% 1996 2001 2006 2011 2011 (CoV) Percentage Year
Movers Non-movers
Source: Statistics Canada Census data (Census Tract 0049.02, 2011)
26 48 16 9 13 25 31 32
10 20 30 40 50 60 0 - 19 20 - 44 45 - 64 65+
Percentage Age
1981 2016
Source: Statistics Canada Census data (Census Tract 0049.02, 2016)
Household Mix 1981 1986 1991 1996 2001 2006 2011 Families with children Target: 25%** False Creek South 40% 40% 29% 28% 26% 23% 22% Metro Vancouver 43% 43% 43% 44% 46% 46% 45% Couples, no children Target 25%** False Creek South 19% 20% 23% 24% 27% 28% 28% Metro Vancouver 26% 25% 26% 25% 25% 25% 26% Singles Target 35%** False Creek South 38% 38% 43% 41% 44% 46% 46% Metro Vancouver 27% 27% 27% 27% 28% 28% 28%
*Custom data order, 2011 **Note: The ODP also included a target for Senior Families at 15%. However, there is no data to assess the current
seniors only.
22.0% 19.0% 24.0% 26.0% 22.0% 26.0% 22.0% 22.0% 21.0% 30.0% 37.0% 29.0%
0% 10% 20% 30% 40% 50% 60% 70% 80% 90% 100%
FCS Metro City of Vancouver
1981 Income Groups
High >$30,000 High-middle $20,000-$29,999 Low-middle $10,000-$19,999 Low 0-$9,999
27% 27% 31% 20% 22% 22% 18% 17% 16% 35% 35% 31%
0% 10% 20% 30% 40% 50% 60% 70% 80% 90% 100% FCS Metro Vancouver
2016 Income Groups*
High (>$100,000) High-Middle ($70,000 - $99,999) Low-Middle ($40,000 - $69,999) Low ($0 - $39,999)
*income groups adjusted for inflation
0% 50% 100% 150% 200% 250% 300% 350% 400%
2001 2016
Source: Census 2001 and 2016, Statistics Canada, MLS Home Price Index, and CMHC Rental Market Survey
62