Fitting smooth-in-time prognostic risk functions via logistic - - PowerPoint PPT Presentation

fitting smooth in time prognostic risk functions via
SMART_READER_LITE
LIVE PREVIEW

Fitting smooth-in-time prognostic risk functions via logistic - - PowerPoint PPT Presentation

Introduction The 2 existing approaches How we fit fully-parametric model Illustration Discussion Summary Fitting smooth-in-time prognostic risk functions via logistic regression James A. Hanley 1 Olli S. Miettinen 1 1 Department of


slide-1
SLIDE 1

Introduction The 2 existing approaches How we fit fully-parametric model Illustration Discussion Summary

Fitting smooth-in-time prognostic risk functions via logistic regression

James A. Hanley1 Olli S. Miettinen1

1Department of Epidemiology, Biostatistics and Occupational Health,

McGill University

Ashton Biometric Lecture Biomathematics & Biostatistics Symposium University of Guelph, September 3, 2008

slide-2
SLIDE 2

Introduction The 2 existing approaches How we fit fully-parametric model Illustration Discussion Summary

OUTLINE

Introduction The 2 existing approaches Semi-parametric model Fully-parametric model How we fit fully-parametric model Illustration Discussion Summary

slide-3
SLIDE 3

Introduction The 2 existing approaches How we fit fully-parametric model Illustration Discussion Summary

CASE I

  • Prob[surv. benefit] if man, aged 58, PSA 9.1, ¯

c ‘Gleason 7’ prostate cancer, selects radical over conservative Tx?

  • RCT: prostate ca. mortality reduced with radical Tx (HR

0.56). 10-y ‘cum. incidence, CI’ of death: 10% vs. 15%.

  • “Benefit of radical therapy ... differed according to age but

not according to the PSA level or Gleason score.”

  • Nonrandomised studies: (1) ‘profile-specific’ prognoses but

limited to conservative Tx (2) few patients took this option (3) n= 45,000 men 65-80: “Using propensity scores to adjust for potential confounders,” the authors reported “a statistically significant survival advantage” in those who chose radical treatment (HR, 0.69)”. An absolute 10-year survival difference (in percentage points) was provided for each “quintile of the propensity score”,

  • MD couldn’t turn info. into surv. ∆ for men with pt’s profile.
slide-4
SLIDE 4

Introduction The 2 existing approaches How we fit fully-parametric model Illustration Discussion Summary

CASE II

  • Physician consults report of a classic randomised trial

(Systolic Hypertension in Elderly Program (SHEP) to assess 5-year risk of stroke for a 65-year old white woman with a SBP of 160 mmHg and how much it is lowered if she were to take anti-hypertensive drug treatment.

  • Reported risk difference was 8.2% - 5.2% = 3%, and the

“favorable effect” of treatment was also found for all age, sex, race, and baseline SBP groups.

  • Report did not provide information from which to estimate

the risk, and risk difference, for this specific profile.

slide-5
SLIDE 5

Introduction The 2 existing approaches How we fit fully-parametric model Illustration Discussion Summary

STATISTICS AND THE AVERAGE PATIENT

  • For a patient,

HR = IDR = 0.6 not very helpful.

CI0−10 = 15% if Tx = 0; 10% if Tx = 1, more helpful.

  • Not specific to this particular type of patient, if grade &

stage {of Pr Ca} or age/race/sex/SPB {SHEP Study} not near the typical of those in trial.

slide-6
SLIDE 6

Introduction The 2 existing approaches How we fit fully-parametric model Illustration Discussion Summary

ARE THESE ISOLATED CASES?

  • Are survival statistics from clinical trials – and

non-randomised studies – limited to the “average” patient?

  • Is Cox regression used merely to ensure ‘fairer

comparisons’?

  • How often is it used to provide profile-specific estimates of

survival and survival differences?

slide-7
SLIDE 7

Introduction The 2 existing approaches How we fit fully-parametric model Illustration Discussion Summary

SURVEY: SURVIVAL STATISTICS IN RCT REPORTS

  • RCT’s : Jan - June 2006 : NEJM, JAMA, The Lancet
  • 20 studies with statistically significant survival difference

between compared treatments w.r.t. primary endpoint.

  • Documented whether presented profile-specific t-year and

Tx-specific survival, { or complement, t-year risk }.

  • Most abstracts contained info. on risk and risk difference

for the ‘average’ patient.

  • Some articles provided RD’s or HR’s for ‘univariate’

subgroups (e.g. by age or by sex).

  • Despite range of risk profiles in each study, and common

use of Cox regression, none presented info. that would allow reader to assess Tx-specific risk for a specific profile, e.g., for a specific age-sex combination.

slide-8
SLIDE 8

Introduction The 2 existing approaches How we fit fully-parametric model Illustration Discussion Summary

WHY THIS CULTURE?

Predominant use of the semi-parametric ‘Cox model.’

  • Time is considered as a non-essential element.
  • Primary focus is on hazard ratios.
  • Form of hazard per se as function of time left unspecified.
  • Attention deflected from estimates of profile-specific CI.
  • Many unaware that software provides profile-specific CI.
slide-9
SLIDE 9

Introduction The 2 existing approaches How we fit fully-parametric model Illustration Discussion Summary

DIFFERENT CULTURE

Practice of reporting estimates of profile-specific probability more common when no variable element of time of outcome.

  • Estimates can be based on logistic regression.
  • Examples
  • (“Framingham-based”) estimated 6-year risk for Myocardial

Infarction as function of set of prognostic indicators;

  • estimated probability that prostate cancer is
  • rgan-confined, as a function of diagnostic indicators.
slide-10
SLIDE 10

Introduction The 2 existing approaches How we fit fully-parametric model Illustration Discussion Summary

WHAT WE WISH TO DO

  • Model the hazard (h), or incidence density (ID), as a

function of

  • set of prognostic indicators
  • choice of intervention
  • prospective time.
  • Estimate the parameters of this function.
  • Calculate

CIx(t) from this function.

slide-11
SLIDE 11

Introduction The 2 existing approaches How we fit fully-parametric model Illustration Discussion Summary

COX MODEL

Hazard modelled, semi-parametrically, as hx(t) = [exp(βx)]λ0(t),

  • T = t: a point in prognostic time,
  • β : vector of parameters with unknown values;
  • X = x : vector of realizations for variates based on

prognostic indicators and interventions;

  • λ0(t) : hazard as a function – unspecified – of t

corresponding to x = 0.

slide-12
SLIDE 12

Introduction The 2 existing approaches How we fit fully-parametric model Illustration Discussion Summary

FROM ˆ β TO PROFILE-SPECIFIC CI’s

  • Obtain

S0(t) { the complement of CI0(t) }.

  • Estimate risk (cum. incidence) CIx(t) for a particular

determinant pattern X = x as CIx(t) = 1 − S0(t)

exp( ˆ βx)

.

  • Breslow suggested an estimator of λ0(t) that gives a

smooth estimate of CIx(t). However, step function estimators of Sx(t), with as many steps as there are distinct failure times in the dataset, are more easily derived, and the only ones available in most packages.

  • Step-function S0(t) estimators: “Kaplan-Meier” type

(“Breslow”) and Nelson-Aalen. heuristics: jh, Epidemiology 2008

  • Clinical Trials article (Julien & Hanley, 2008) encourages

investigators to make more use of these for ‘profiling’.

slide-13
SLIDE 13

Introduction The 2 existing approaches How we fit fully-parametric model Illustration Discussion Summary

TOO MUCH OF A GOOD THING? - 1992

the success of Cox regression has perhaps had the unintended side-effect that practitioners too seldomly invest efforts in studying the baseline hazard... a parametric version, ... if found to be adequate, would lead to more precise estimation of survival probabilities. Hjort, 1992, International Statistical Review

slide-14
SLIDE 14

Introduction The 2 existing approaches How we fit fully-parametric model Illustration Discussion Summary

TOO MUCH OF A GOOD THING? - 2002

Hjort’s statement has been “apparently little heeded” in the Cox model, the baseline hazard function is treated as a high-dimensional nuisance parameter and is highly erratic. {we propose to estimate it} informatively (that is, smoothly), by natural cubic splines. Royston and Parmar, 2002, Statistics in Medicine

slide-15
SLIDE 15

Introduction The 2 existing approaches How we fit fully-parametric model Illustration Discussion Summary

TOO MUCH OF A GOOD THING? - 1994

Reid: How do you feel about the cottage industry that’s grown up around it [the Cox model]? Cox: Don’t know, really. In the light of some of the further results one knows since, I think I would normally want to tackle problems parametrically, so I would take the underlying hazard to be a Weibull or something. I’m not keen on nonparametric formulations usually.

slide-16
SLIDE 16

Introduction The 2 existing approaches How we fit fully-parametric model Illustration Discussion Summary

TOO MUCH OF A GOOD THING? - 1994 ...

Reid: So if you had a set of censored survival data today, you might rather fit a parametric model, even though there was a feeling among the medical statisticians that that wasn’t quite right. Cox: That’s right, but since then various people have shown that the answers are very insensitive to the parametric formulation of the underlying distribution [see, e.g., Cox and Oakes, Analysis of Survival Data, Chapter 8.5]. And if you want to do things like predict the outcome for a particular patient, it’s much more convenient to do that parametrically. . . . . Reid N. A Conversation with Sir David Cox. . . . . Statistical Science, Vol. 9, No. 3 (1994), pp. 439-455

slide-17
SLIDE 17

Introduction The 2 existing approaches How we fit fully-parametric model Illustration Discussion Summary

FULLY-PARAMETRIC MODEL: FORM

log{h(x, t)} = g(x, t, β) ⇐ ⇒ h(x, t) = eg(x,t,β)

  • x is a realization of the covariate vector X, representing

the patient profile P, and possible intervention I.

  • β : a vector of parameters with unknown values,
  • g() includes constant 1, variates for P, I;
  • g() can have product terms involving P, I, and t.
  • g() must be ‘linear’ in parameters, in ‘linear model’ sense.
  • ‘proportional hazards’ if no product terms involving t & I
  • If t is represented by a linear term (so that ‘time to event’

∼ Gompertz), then CIp, i(t) has a closed smooth form.

  • If t is replaced by log t, then ‘time to event’ ∼ Weibull.
slide-18
SLIDE 18

Introduction The 2 existing approaches How we fit fully-parametric model Illustration Discussion Summary

FULLY-PARAMETRIC MODEL: FITTING

  • Parameters of this loglinear hazard function can be

numerically estimated by maximizing the likelihood.

  • Unable to find a ready-to-use procedure within the

common statistical packages.

  • Likelihood becomes quite involved even if no censored
  • bservations.
  • Albertsen and Hanley(1998), Efron(1988, 2002), and

Carstensen(2000-) have circumvented these technical problems of fitting by dividing the observed ‘survival time’

  • f each subject into a number of time-slices and treating

the number of events in each as a Binomial (1988) or Poisson (2002) variate.

slide-19
SLIDE 19

Introduction The 2 existing approaches How we fit fully-parametric model Illustration Discussion Summary

FULLY-PARAMETRIC MODEL: OUR APPROACH

  • An extension of the method of Mantel (1973) to binary
  • utcomes with a time dimension.
  • Mantel’s problem:
  • (c =)165 ‘cases’ of Y = 1,
  • 4000 instances of Y = 0.
  • Associated regressor vector X for each of the 4165
  • A logistic model for Prob(Y = 1 | X)
  • A computer with limited capacity.
slide-20
SLIDE 20

Introduction The 2 existing approaches How we fit fully-parametric model Illustration Discussion Summary

MANTEL ’S SOLUTION

  • Form a reduced dataset containing...
  • All c instances (cases) of Y = 1
  • Random sample of the Y = 0 observations
  • Fit the same logistic model to this reduced dataset.

“Such sampling will tend to leave the dependence of the log odds on the variables unaffected except for an additive constant.” Anderson (Biometrika, 1972) had noted this too.

  • Outcome(Choice)-based sampling common in Epi, Marketing, etc...
slide-21
SLIDE 21

Introduction The 2 existing approaches How we fit fully-parametric model Illustration Discussion Summary

DATA TO EXPLAIN OUR APPROACH

Systolic Hypertension in Elderly Program (SHEP)

.......................... SHEP Cooperative Research Group (1991). .......................... Journal of American Medical Association 265, 3255-3264.

  • ??? Effectiveness of antihypertensive drug treatment in

preventing (↓ risk of) stroke in older persons with isolated systolic hypertension.

  • We obtained data, without subject identifications, under

program “NHLBI Datasets Available for Research Use”.

  • 4,701 persons with complete data on P = {age, sex, race,

and systolic blood pressure} and I = {active, placebo}.

  • Study base of B = 20, 894 person-years of follow-up;

c = 263 events ("cases") of stroke identified.

slide-22
SLIDE 22

Introduction The 2 existing approaches How we fit fully-parametric model Illustration Discussion Summary

STUDY BASE, and the 263 cases

1 2 3 4 5 6 7 1000 2000 3000 4000 5000 6000

t: Years since Randomization Persons

  • No. of Persons

Being Followed

STUDY BASE

− 20,894 person−years [B=20,894 PY] − 10,982,000,000 person−minutes (approx) − infinite number of person−moments

c = 263 events (Y=1) in this infinite number

  • f person−moments
  • infinite number
  • f person−moments

with Y=0

slide-23
SLIDE 23

Introduction The 2 existing approaches How we fit fully-parametric model Illustration Discussion Summary

THE ETIOLOGIC STUDY IN EPIDEMIOLOGY

  • Aggregate of population-time: ‘study base.’
  • All instances of event in study base identified → study’s

‘case series’ of person-moments, characterized by Y = 1.

  • Study base – infinite number of person-moments – sampled

→ corresponding ‘base series,’ characterized by Y = 0.

  • Document potentially etiologic antecedent, modifiers of

incidence-density ratio, & confounders.

  • Fit Logistic model

.............................................................................................

  • With our approach . . .
  • → Incidence density, hx(u) in study base.
  • → CIx(t) = 1 − exp{−Hx(t)} = 1 − exp{−

t

0 hx(u)du}.

slide-24
SLIDE 24

Introduction The 2 existing approaches How we fit fully-parametric model Illustration Discussion Summary

WHAT MAKES OUR APPROACH WORK

  • Base series: representative (unstratified) sample of base.
  • → logistic model, with t having same status as x, and
  • ffset, directly yields

IDx,t = exp{ g(x, t)}.

  • Using same argument (algebra) as Mantel...

b = size of base series B = amount of population-time constituting study base. Prob(Y = 1|{x, t}) Prob(Y = 0|{x, t}) = lim

ǫ→0

h(x, t)ǫ 1 − h(x, t)ǫ × B/ǫ b = h(x, t) × B b . log

  • Prob(Y = 1|{x, t})

Prob(Y = 0|{x, t})

  • = log[h(x, t)] + log(B/b).
  • log(B/b) is an Offset [a regression term with known coefficient of 1].
slide-25
SLIDE 25

Introduction The 2 existing approaches How we fit fully-parametric model Illustration Discussion Summary

How large should b be on relation to c?

Mantel (1973)... [our notation, and slight change of wording]

By the reasoning that cb/(c + b) [= (1/c + 1/b)−1] measures the relative information in a comparison of two averages based on sample sizes of c and b respectively, we might expect by analogy, which would of course not be exact in the present case, that this approach would result in only a moderate loss of information. (The practicing statistician is generally aware of this kind of thing. There is little to be gained by letting the size of one series, b, become arbitrarily large if the size of the other series, c, must remain fixed.)

  • With 2008 computing, we can use a b/c ratio as high as 100.
  • b/c = 100 → Var[ˆ

β]b/c=100 = 1.01 × Var[ˆ β]b/c=∞, i.e. 1% ↑

  • Var[ˆ

β] ∝ 1/c + 1/100c rather than 1/c + 1/∞.

slide-26
SLIDE 26

Introduction The 2 existing approaches How we fit fully-parametric model Illustration Discussion Summary

OUR HAZARD MODEL FOR SHEP DATA

log[h] = ΣβkXk, where X1 = Age (in yrs) - 60 X2 = Indicator of male gender X3 = Indicator of Black race X4 = Systolic BP (in mmHg) - 140 ...................................................................... X5 = Indicator of active treatment ...................................................................... X6 = T ...................................................................... X7 = X5 × X6. (non-proportional hazards)

slide-27
SLIDE 27

Introduction The 2 existing approaches How we fit fully-parametric model Illustration Discussion Summary

PARAMETER ESTIMATION

  • Formed person-moments dataset pertaining to:
  • case series of size c = 263 (Y = 1)

and

  • (randomly-selected) base series of size b = 26, 300

(Y = 0).

  • Each of 26,563 rows contained realizations of
  • X1, . . . , X7
  • Y
  • offset = log(20, 894/26, 300).
  • Logistic model fitted to data in the two series.
slide-28
SLIDE 28

Introduction The 2 existing approaches How we fit fully-parametric model Illustration Discussion Summary

DATASET FOR LOGISTIC REGRESSION

(SCHEMATIC)

1 69 1 0 166 1 0.57 1 69 0 1 161 0 1.79 1 85 0 1 184 0 3.39 0 69 0 0 182 0 1.70 0 73 0 1 167 1 2.02 0 73 1 0 199 0 0.62 0 81 1 0 161 0 1.16 0 70 0 1 185 0 1.11 0 72 0 0 172 1 3.56 Y Age B M SBP I t

1000 2000 3000 4000 5000 1 2 3 4 5 6 Prognostic time (years) Persons

slide-29
SLIDE 29

Introduction The 2 existing approaches How we fit fully-parametric model Illustration Discussion Summary

DATASET: c = 263; b = 10 × 263

  • 1

2 3 4 5 6 1000 2000 3000 4000

Time Persons

slide-30
SLIDE 30

Introduction The 2 existing approaches How we fit fully-parametric model Illustration Discussion Summary

FITTED VALUES

Proposed Cox logistic regression regression βage−60 0.041 0.041 0.041 βImale 0.257 0.258 0.259 βIblack 0.302 0.301 0.303 βSBP−140 0.017 0.017 0.017 .................... βIActive treatment

  • 0.200
  • 0.435
  • 0.435

.................... β0

  • 5.390
  • 5.295

βt

  • 0.014
  • 0.057

βt×IActive treatment

  • 0.107
  • Fitted logistic function represents log[hx(t)]
  • → cumulative hazard HX(t), and, thus, X-specific risk.
slide-31
SLIDE 31

Introduction The 2 existing approaches How we fit fully-parametric model Illustration Discussion Summary

ESTIMATED 5-YEAR RISK OF STROKE

Risk I h(t) H(5) CI(5) ∆ [ ID(t) ] [ 5

0 hx(t)dt ]

[ 1 − e−H(5) ] Low e−4.86−0.014t 0.037 0.036 1 e−5.06−0.124t 0.024 0.024 1.2% High 0.16 1 0.10 6% Overall 0.076 1 0.049 2.7% Low: 65 year old white female with a SBP of 160 mmHg. High: 80 year old black male with a SBP of 180 mmHg

slide-32
SLIDE 32

Introduction The 2 existing approaches How we fit fully-parametric model Illustration Discussion Summary

1 2 3 4 5 5 10 15 Prospective time (years) Cumulative incidence (%) (a.0): 80 year old black male, SBP=180 (a.1) (b.1): 65 year old white female, SBP=160 (b.0) semi−parametric (Cox) proposed

slide-33
SLIDE 33

Introduction The 2 existing approaches How we fit fully-parametric model Illustration Discussion Summary

Points

1 2 3 4 5 6 7 8 9 10

Age

60 65 70 75 80 85 90 95 100

Male

1

Black

1

SBP

155 165 175 185 195 205 215

I

1

t

6

I.t

6 5 4 3 2 1

Total Points

2 4 6 8 10 12 14 16 18 20 22

Linear Predictor

−6 −5.5 −5 −4.5 −4 −3.5 −3 −2.5

5−year Risk (%) if not treated

3 4 5 6 7 8 9 12 15 18

5−year Risk (%) if treated

2 3 4 5 6 7 8 9 12 15 18

slide-34
SLIDE 34

Introduction The 2 existing approaches How we fit fully-parametric model Illustration Discussion Summary

  • ● ●
  • ● ● ●
  • ● ●
  • ● ● ●
  • 5

10 15 20 25 −6.0 −5.6 −5.2 −4.8

intercept sample

  • ● ● ●
  • ● ●
  • ● ● ●
  • ● ● ● ● ● ●

5 10 15 20 25 0.02 0.04 0.06

age sample

  • ● ●
  • ● ● ● ●
  • 5

10 15 20 25 0.0 0.2 0.4

male sample

  • ● ● ● ●
  • ● ●
  • ● ● ● ● ● ● ● ● ● ● ● ●

5 10 15 20 25 0.0 0.2 0.4 0.6

black sample

  • ● ● ● ●
  • ● ●
  • ● ● ●
  • ● ● ● ● ● ● ●
  • 5

10 15 20 25 0.005 0.015 0.025

sbp sample

  • ● ● ● ●
  • ● ● ●
  • ● ●
  • ● ● ● ●

5 10 15 20 25 −0.8 −0.4 0.0 0.4

tx sample

  • ● ●
  • ● ●
  • ● ● ●
  • ● ● ● ● ●
  • ● ●

5 10 15 20 25 −0.15 −0.05 0.05

t sample

  • ● ● ● ● ●
  • ● ● ●
  • ● ●
  • ● ●
  • ● ●

5 10 15 20 25 −0.3 −0.1 0.0 0.1

tx*t sample

  • ● ●
  • ● ● ● ●
  • ● ● ● ● ● ● ● ● ● ● ● ●
  • 5

10 15 20 25 0.10 0.15 0.20
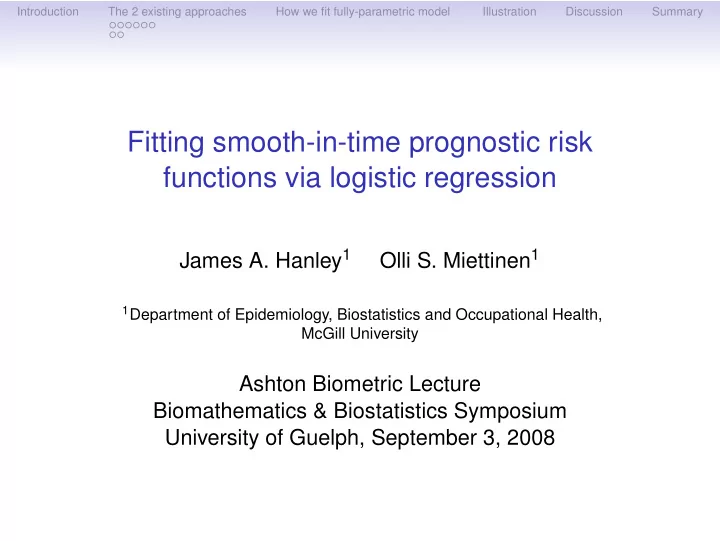
5 year Risk sample

STABILITY ?

Point and (95% confidence) interval estimates of hazard function, and of 5-year risk for a specific (untreated) high-risk

  • profile. Fits are based
  • n 25 different random

samples of b =26,300 from the infinite number of person-moments in the study base, and same c = 263 cases each run.

slide-35
SLIDE 35

Introduction The 2 existing approaches How we fit fully-parametric model Illustration Discussion Summary

KEY POINTS

  • Focus on ‘individualized’ – profile-specific – risk functions.
  • Cox model CI’s seldom used: dislike ‘step-function’ form?
  • Smooth-in-t h(t)—and CI’s– not new; fitting procedure is.
  • Borrow from the etiologic study in epidemiology:

case series + base series + logistic regression.

  • Not just hazard ratio, but hazard per se.
  • Keys: 1. representative sampling of the base; 2. offset.
  • Information re hx(t) constrained by c.
  • Virtually 100% extracted when b suitably large relative to c.
  • b/c =100 feasible and adequate.
slide-36
SLIDE 36

Introduction The 2 existing approaches How we fit fully-parametric model Illustration Discussion Summary

MODELLING POSSIBILITIES

Log-linear modelling for hx(t) via logistic regression ...

  • Standard methods to assess model fit.
  • Wide range of functional forms for the t-dimension of hx(t).
  • Effortless handling of censored data.
  • Flexibility in modeling non-proportionality over t.
  • Splines for h(t) rather than hr(t).
slide-37
SLIDE 37

Introduction The 2 existing approaches How we fit fully-parametric model Illustration Discussion Summary

DATA ANALYZED BY EFRON, 1988

Arm A [ time-to-recurrence of head & neck cancer ]

  • Cum. Inc. estimates – K-M, Efron & Proposed

10 20 30 40 50 Months Cumulative Incidence Incidence Density

0.05 0.1 0.15 0.2 0.4 0.6 0.8 1

  • Inc. density estimates – Efron & Proposed

Arm A vs. Arm B

.

10 20 30 40 50 Months Cumulative Incidence Incidence Density

0.05 0.1 0.15 0.2 0.4 0.6 0.8 1

A B A: Radiation Alone B: Radiation + Chemotherapy A B

.

slide-38
SLIDE 38

Introduction The 2 existing approaches How we fit fully-parametric model Illustration Discussion Summary

CLINICAL POSSIBILITIES / DESIDERATA

  • PDAs (personal digital assistants) → online information.
  • Profile-specific risk estimates for various interventions.
  • Already, online calculators: risk of MI, Breast/Lung Cancer;

probability of extra-organ spread of cancer.

  • RCT reports should contain: suitably designed risk

function, fitted parameters of hx(t), and risk function.

  • (Offline:) risk scores → risks via nomogram/table.
slide-39
SLIDE 39

Introduction The 2 existing approaches How we fit fully-parametric model Illustration Discussion Summary

SUMMARY

  • Profile-specific risk (CI) functions are important.
  • Two paths to CI, via...
  • Steps-in-time S0(t)
  • Smooth-in-time IDx(t).
  • New simple estimation method for broad class of

smooth-in-time ID functions.

  • Biostatistics & Epidemiology methods: a little more unified?
slide-40
SLIDE 40

Introduction The 2 existing approaches How we fit fully-parametric model Illustration Discussion Summary

FUNDING / CO-ORDINATES

Natural Sciences and Engineering Research Council of Canada James.Hanley@McGill.CA

http:/ p: /ww ww www.m w.m w.m mcgill.ca/ ca/ a epi epi epi epi-bi biost

  • st

s at- at- a occh/g /g grad/bi b ostatisti t cs/