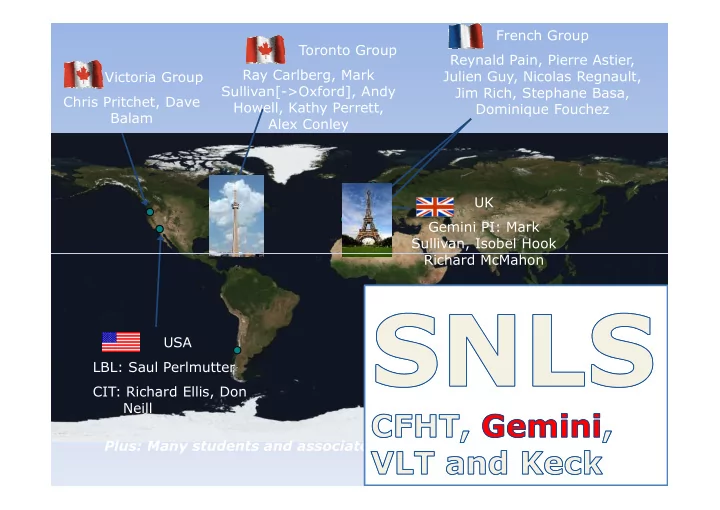
SLIDE 1 French Group Reynald Pain, Pierre Astier, Julien Guy, Nicolas Regnault, Jim Rich, Stephane Basa, Dominique Fouchez UK Gemini PI: Mark Sullivan, Isobel Hook Richard McMahon Victoria Group Chris Pritchet, Dave Balam Toronto Group Ray Carlberg, Mark Sullivan[->Oxford], Andy Howell, Kathy Perrett, Alex Conley Richard McMahon USA LBL: Saul Perlmutter CIT: Richard Ellis, Don Neill
SLIDE 2
Dark Energy
Einstein
GR E Eqns metric constant 6 ~ (1+z)3(1+w), w=-1 6DE ~ (1+z)3(1+w), w=-1
Scaler Field Theory
Inflation inspiration Quintessence Interesting values near w=-0.8
SLIDE 3 From LSS
=
Huterer & Turner 2000
Slightly modified version of figure in Huterer & Turner 2000 (astro-ph/0012510)
SLIDE 5
SNLS1w=-1.02±0.09 (stat)
SLIDE 6
SNLS1 (Astier 06) weaknesses
Sample of only 72 at z>0.1
Patchy 4 filter data Calibration somewhat uncertain
Sample of ~40 at z<0.1 Sample of ~40 at z<0.1
Unknown selection function Landolt Vega calibration (1950’s)
Systematic errors not fully accounted
SLIDE 7
WMAP Beam recalibration
SLIDE 8
SDSS/2dF, BAO
SLIDE 9
SNLS Third Year
SLIDE 10
244 spectro’ed Ia to Aug 07
SLIDE 11
SLIDE 12 <w>= <w>= <w>= <w>=-
0.982 0.982 0.982 ± ± ± ± 0.044, 0.044, 0.044, 0.044, Ω Ω Ω ΩM
M M M=0.267
=0.267 =0.267 =0.267 ± ± ± ± 0.014 0.014 0.014 0.014 Factor of 3 below SNLS1 Factor of 3 below SNLS1 Factor of 3 below SNLS1 Factor of 3 below SNLS1 Ω Ω Ω ΩM
M M M!
! ! ! About factor of 2 better than early SNLS3 About factor of 2 better than early SNLS3 About factor of 2 better than early SNLS3 About factor of 2 better than early SNLS3
SLIDE 13
SALT2/SIFTO Distance Model
First, fit the Light Curves
No cosmology except redshift Separates the LC problem from cosmology
m* = mB + α(s!1) + βc,
O=m*-M has all of the cosmology O=m*-M has all of the cosmology mB is the B brightness at peak s is stretch c is roughly a U-B color α,β,M are fitted “nuisance parameters”
No compelling evidence so far of anything more.
Need more colors to be measured (IR, UV)
SLIDE 14
Light Curve fitters
SALT2: many parameter fit
Trained at low-z Color relations built in (all filter fits)
SIFTO: SCP heritage, advanced SIFTO: SCP heritage, advanced
LC’s defined at low z Each filter independent
SLIDE 15
SIFTO LC’s and errors
SLIDE 16 Light Curve Fitters
(low redshift training, same high redshift A06 data) stretch varies with wavelength—redder slower Method RMS (mag)
comment
SALT 0.179
A06 (SNLS1)
SALT 0.179
A06 (SNLS1)
SALT2 0.159 SiFTO 0.160 MLCS2k2 0.205
Hubble Bubble “on”
SLIDE 17
What is New?
More, better SNLS data (~10x) More, better low-z data (CfA, SDSS) Calibration to BD+17 4708 (F0 sD)
Both Megaprime and nearby data Both Megaprime and nearby data Removes an R and I band problem
LC stretch depends on wavelength U-B color to predict B-V statistically Massive MC simulations of biases
SLIDE 18 SNLS color-color relations
important to determine “c”
SLIDE 19 Usual minimization: χ2 = ∑ [(mi – m(bi,si,ci )/σi]2 i = mi – [bi +α(si 1)+βci ] Generalized to matrix: χ2 = T V1 , whereV error matrix Statistical : V = σ + α2σ +β2σ +aσ2 + +βσ2 +aβσ2
Errors for Hubble diagam fits
6 error (diagonal) + 6 systematics matrices
Statistical : Vstat = σbb+ α2σss +β2σcc +aσ2
bs + +βσ2 bc +aβσ2 s
Systematic: Each source of error traced through to distance model Many are correlated (e.g. filter calibration effects most distances) Creates a nearly filled matrix (NxN is number of supernova) Need to iterate because α ,β determined in fit. Leads to 6 statistical and 6 systematic error matrices
SLIDE 20
Cosmological constraints (flat) Cosmological constraints (flat)
SLIDE 21
SNLS3 prelim w(a) analysis
SLIDE 22
Color Nightmare 2: β
Color not understood:
Temperature, Metallicity, Explosion Details and Explosion Details and Dust.
Intrinsic + Extrinsic
Dust β~4.1 Dustless β~2
Redshift variation (selection effects…)
SLIDE 23
Warning: Bogus evolution! (Emma makes no mistakes) (Emma makes no mistakes) Sample Sne become bluer and brighter with increasing redshift—gives many false trends that are due to selection.
SLIDE 24 Where next?
Ia continue to be surprisingly good
Astrophysical interest Much potential for cosmological refinement σw ~ 2-3σmags , σw of 2-3% should be possible
Careful design (JDEM + low z Hubble flow)
Multi-color (next step 3 c’s) Multi-color (next step 3 c’s)
UV diversity? Dust metallicity
Calibration (low z, high z, space)
Note: same data fit other cosmologies about equally well (e.g. DGP)