
SLIDE 1
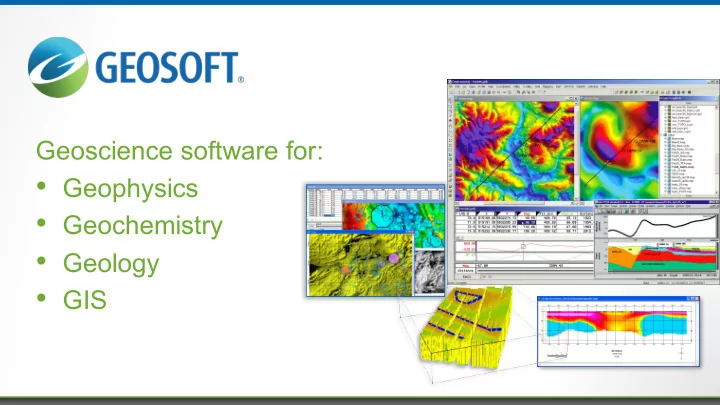
Geoscience software for:
- Geophysics
- Geochemistry
- Geology
- GIS
How does Geosoft use EM & Electrical methods? IP & DC - - PowerPoint PPT Presentation
Geoscience software for: Geophysics Geochemistry Geology GIS How does Geosoft use EM & Electrical methods? IP & DC resistivity QC, processing and 3D pseudosection visualizeation 3D inversion FDEM
2
IP & DC resistivity
FDEM
TDEM for UXO –EM61 MK2, (3-4 time gates)
TDEM for UXO – Geometrics - Metal Mapper
Nose Down Horizontal
Munitions Response Typical Cost Breakout
5 10 15 20 25 30 35 40 45 50
Site Assessment Survey and Mapping Vegetation Removal Scrap Metal Removal UXO Removal & Disposal
Cost - $B
Defense Science Board Task Force on UXO
Designed for Classification
Time (ms) 0.1 1 10 Polarizability
10-3 10-2 10-1 100 101
P1 P2 P3
time (ms) voltage
The solution for classification – intrinsic features
Measured Decays Convolve Intrinsic Response with Relative Position and Orientation – Position “A”
R(X) R(Y) R(Z) Rx0 Rx1 Rx2 Rx3 Rx2 Rx3 Rx0 Rx1 R(X) R(Y) R(Z)
Tx2 Tx3
R(X) R(Y) R(Z) Rx0 Rx1 Rx2 Rx3
Tx0
R(X) R(Y) R(Z) Rx2 Rx3 Rx0 Rx1
Tx1
Time (ms) 0.1 1 10 Polarizability
10-3 10-2 10-1 100 101
P1 P2 P3
Measured Decays Convolve Intrinsic Response with Relative Position and Orientation – Position “B”
R(X) R(Y) R(Z) Rx0 Rx1 Rx2 Rx3 Rx2 Rx3 Rx0 Rx1 R(X) R(Y) R(Z)
Tx2 Tx3
R(X) R(Y) R(Z) Rx0 Rx1 Rx2 Rx3
Tx0
R(X) R(Y) R(Z) Rx2 Rx3 Rx0 Rx1
Tx1
Time (ms) 0.1 1 10 Polarizability
10-3 10-2 10-1 100 101
P1 P2 P3
Measured Decays Convolve Intrinsic Response with Relative Position and Orientation – Position “C”
R(X) R(Y) R(Z) Rx0 Rx1 Rx2 Rx3 Rx2 Rx3 Rx0 Rx1 R(X) R(Y) R(Z)
Tx2 Tx3
R(X) R(Y) R(Z) Rx0 Rx1 Rx2 Rx3
Tx0
R(X) R(Y) R(Z) Rx2 Rx3 Rx0 Rx1
Tx1
Time (ms) 0.1 1 10 Polarizability
10-3 10-2 10-1 100 101
P1 P2 P3
§ intrinsic to the target § invariant to burial depth or target
Polarizability Property Target Property Decay Rate Wall Thickness Relative Magnitude Shape Total Magnitude Size (volume)
37mm projectile
Signature Matching
Signature Variability
band at base band missing band in middle e.g. 37mm projectile rotating band effects
17
18