Inside Track Where next for Renewables? Bristol University Elaine - - PowerPoint PPT Presentation

inside track where next for renewables
SMART_READER_LITE
LIVE PREVIEW

Inside Track Where next for Renewables? Bristol University Elaine - - PowerPoint PPT Presentation

The Renewables Consulting Group <Month, Day, 2015> Inside Track Where next for Renewables? Bristol University Elaine Greig, Director This document is confidential and is intended solely for the use and information of the client to


slide-1
SLIDE 1

The Renewables Consulting Group This document is confidential and is intended solely for the use and information of the client to whom it is addressed.

Inside Track – Where next for Renewables?

Bristol University Elaine Greig, Director

<Month, Day, 2015>

slide-2
SLIDE 2

The Renewables Consulting Group

My career:

1

Previous roles » Head of Offshore Renewables, DNV-GL Renewables » Project Director, Vattenfall » Development Manager, Amec Wind » Grid Connections Manager & Electrical Engineer, Amec Wind » Power Systems Analyst, ERA Technology » Applications Engineer, PB Power

Elaine Greig

Current role - Director, Head of EMEA Renewables Consulting Group Projects » PD: Aberdeen Bay Offshore Wind Farm, £10m development of £250m capex » PD: Edinbane Onshore wind farm, Skye, £60m capex » Grid connections manager & electrical engineer: 30 onshore projects;

  • ffshore - Lynn, Docking Shoal, Race Bank, Thanet, Aberdeen, Beatrice

demonstrator, Cape Wind (USA) » Fault level, load flow, transient stability, harmonic & protection studies Education » BSc MEng Electrical Engineering, Manchester » MBA, Durham » MIET » CEng, Engineering Council » Member RedR

slide-3
SLIDE 3

The Renewables Consulting Group

EU Electricity – installed capacity (MW)

2

Source: EWEA Annual Statistics 2015 doesn’t show what actually used, capacity factors will be different by technology

545 GW

Coal 24% Nuclear 23% Hydro 21% Gas 17% Fuel Oil 11% Wind 2% Other 2%

EU Electricity 2000, %

Gas 21% Coal 17% Wind 16% Hydro 15% Nuclear 13% Solar PV 11% Fuel Oil 4% Biomass 1% Other 2%

EU Electricity 2015, %

908 GW

A step change for renewables Alongside a large increase in usage

slide-4
SLIDE 4

The Renewables Consulting Group

The UK’s changing electricity generation mix – how we got to here

3

10 20 30 40 50 60 70 80 90 1960 1961 1962 1963 1964 1965 1966 1967 1968 1969 1970 1971 1972 1973 1974 1975 1976 1977 1978 1979 1980 1981 1982 1983 1984 1985 1986 1987 1988 1989 1990 1991 1992 1993 1994 1995 1996 1997 1998 1999 2000 2001 2002 2003 2004 2005 2006 2007 2008 2009 2010 2011 2012 2013 2014

UK Electricity source %

Coal Oil Gas Nuclear Hydroelectric Renewable

Data Source: World Bank Nuclear build programme Coal dominates from industry inception (late 1800s) Fossil fuels used depending on cost & availability 1990s ‘dash for gas’ The ‘rise of renewables’ 2016 – battery boom

  • potential

enabler to the continued rise of renewables

slide-5
SLIDE 5

The Renewables Consulting Group

Current UK energy sources and use – where next?

4

10000 20000 30000 40000 50000

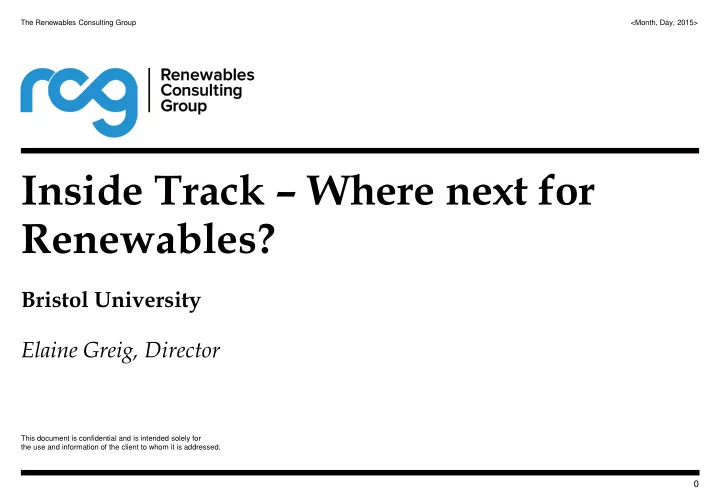
UK electricity generation (inst. MW) by BM units (licenced, i.e. >100MW, or optional between 50-100MW), October 2016

coal

  • ther

wind & hydro PS nuclear interconnectors CCGT, OCGT, Oil

Graph shows BM Units only– a lot of wind & solar is thus not shown. UK electrical energy is ~25% renewables Will electric cars, which will increase electricity demand, be able to also level the demand profile? 99% of all electricity storage is pumped storage (PS), 1200MW, typically battery, storage submitted to the 200MW auction by NGET for enhanced frequency response Coal plants are closing – phasing out by 2025 or earlier. Nearly 10,000GWh in Jan 2015, to ~1000GW today UK solar surpassed UK electricity from coal in April 2016, solar produced 50% more GWh in May 2016 (solar up, coal very down) Scotland’s wind farms provided almost 50% of need in 2014 and produced 106% of Scotland's energy needs on 07 August 2016 Silver bullet of storage: 1990s – magnetic bearing flywheels research; 2000s – superconducting magnetic circuit research 2010s – LiIon battery costs come down by 70%, thanks to car manufacturers developing - reality If commercial arrangements are put in place enabling storage to time-shift energy, breaking the link between fossil fuels feeding demand variation, then further renewables penetration is enabled, subject to

  • cost. Lots of

storage and renewables will be needed Non-BMU generation appears to the grid as negative demand – profile unknown Data Source: Elexon DBEIS analyse complete/true energy source statistics on a monthly basis – the load profile is invisible The current market for storage in the UK is in EFR (limited), electricity company innovation zones, renewables developers maximising the use of limited connections, and sites waiting for change The system needs storage at demand centres, to avoid wasted energy and to provide voltage support The evidence from the large wind & hydro BMUs, is renewables provide consistent electricity in aggregate, as

  • pposed to demand

Then which renewables and where do they go? Onshore land use is very sensitive,

  • ffshore wind has huge

potential, tidal has limited potential, solar has further potential on land, water and

  • buildings. Biomass is

contentious due to sources.