
Investigating the Use of a Dynamic Physical Bar Chart for Data Exploration and Presentation
Faisal Taher, Yvonne Jansen, Jonathan Woodruff, John Hardy, Kasper Hornbæk, and Jason Alexander.
Abstract—Physical data representations, or data physicalizations, are a promising new medium to represent and communicate
- data. Previous work mostly studied passive physicalizations which require humans to perform all interactions manually. Dynamic
shape-changing displays address this limitation and facilitate data exploration tasks such as sorting, navigating in data sets which exceed the fixed size of a given physical display, or preparing “views” to communicate insights about data. However, it is currently unclear how people approach and interact with such data representations. We ran an exploratory study to investigate how non- experts made use of a dynamic physical bar chart for an open-ended data exploration and presentation task. We asked 16 participants to explore a data set on European values and to prepare a short presentation of their insights using a physical display. We analyze: (1) users’ body movements to understand how they approach and react to the physicalization, (2) their hand-gestures to understand how they interact with physical data, (3) system interactions to understand which subsets of the data they explored and which features they used in the process, and (4) strategies used to explore the data and present observations. We discuss the implications of our findings for the use of dynamic data physicalizations and avenues for future work. Index Terms—Shape-changing displays, physicalization, physical visualization, bar charts, user behaviour, data presentation.
1 INTRODUCTION Physical data visualizations, or data physicalizations, are “artifacts whose geometry or material properties encode data” designed to better support “cognition, communication, learning, problem solving, and decision making” [18]. Recent work provides evidence of their benefits including their utility as education tools [32], as mediators to engage people in data exploration [24][31], or to increase the understanding of statistical data [11]. In popular media, Hans Rosling uses physicalizations to communicate data on global health [7]. While the majority of previous work in this area has focused on passive, fabricated physicalizations, shape-changing technology (e.g., inFORM [9], EMERGE [29]) promises to increase the interactivity of physicalizations to eventually reach a similar level of control as that possible with on-screen visualizations. For example, Microsoft’s Physical Charts [26] demonstrates dynamic bars and pie charts, and Taher et al. [29] derived initial interaction preferences for a physically dynamic bar chart. Despite the promise of dynamic physicalizations, our knowledge
- f how users interact with these systems is limited. Specifically,
there are no empirical studies exploring user behaviour around physicalizations or how physicalizations are used to present and describe the data to others. We are left with important questions: How do users move around and interact with such a display? How do they orient themselves in a dataset larger than the physical display? What strategies are used to describe their observations? This paper aims to answer these questions through empirical observations of how people behave, interact with, and present observations using a dynamic physical data system. We present a user study with 16 participants using EMERGE [29], a physically dynamic bar chart with a grid of 100 self-actuating
- bars. During the study, participants were asked to explore an unseen
dataset to discover themes, and present these themes and their relationships using the dynamic physicalization. We recorded and analyzed video and birds-eye-view Kinect data to examine participants’ hand, arm, and body movements (e.g., see Fig. 1). System interaction logs were examined to analyze how people navigated through a dataset exceeding the size of the physical viewport and which functionalities were used. Further, we discuss the strategies that participants used to explore and present
- bservations using EMERGE. We use these insights to characterize
behaviours and interactions, and to identify avenues for future work. This paper therefore contributes characterizations of: (1) users’ body movements to understand how they approach and react to the physicalization, (2) their hand-gestures to understand how they interact with data, (3) system interactions to understand which
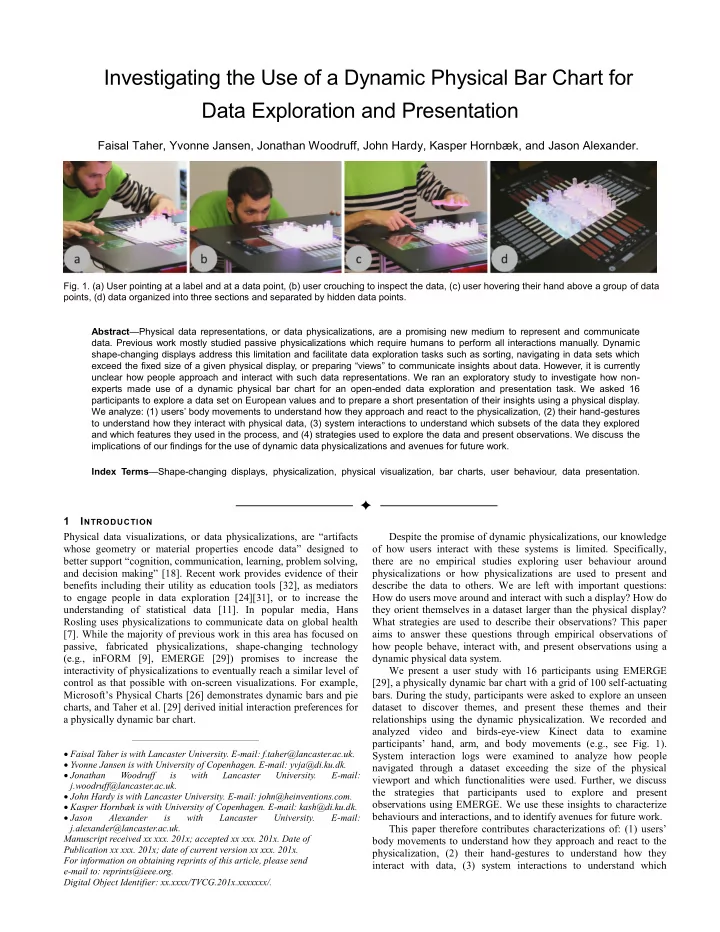
- Fig. 1. (a) User pointing at a label and at a data point, (b) user crouching to inspect the data, (c) user hovering their hand above a group of data
points, (d) data organized into three sections and separated by hidden data points. Faisal Taher is with Lancaster University. E-mail: f.taher@lancaster.ac.uk. Yvonne Jansen is with University of Copenhagen. E-mail: yvja@di.ku.dk. Jonathan Woodruff is with Lancaster University. E-mail: j.woodruff@lancaster.ac.uk. John Hardy is with Lancaster University. E-mail: john@heinventions.com. Kasper Hornbæk is with University of Copenhagen. E-mail: kash@di.ku.dk. Jason Alexander is with Lancaster University. E-mail: j.alexander@lancaster.ac.uk. Manuscript received xx xxx. 201x; accepted xx xxx. 201x. Date of Publication xx xxx. 201x; date of current version xx xxx. 201x. For information on obtaining reprints of this article, please send e-mail to: reprints@ieee.org. Digital Object Identifier: xx.xxxx/TVCG.201x.xxxxxxx/.