One third of the employment is also in the agricultural sector. - - PDF document

one third of the employment is also in the agricultural
SMART_READER_LITE
LIVE PREVIEW

One third of the employment is also in the agricultural sector. - - PDF document

31/03/2012 Sri Lankan Agriculture and Food security in a Present Status, Issues and Future Nut Shell Trends in Fruit and Vegetable Handling, An agriculture based country Distribution and Marketing in Sri Lanka Agriculture contribution


slide-1
SLIDE 1

31/03/2012 1

Present Status, Issues and Future Trends in Fruit and Vegetable Handling, Distribution and Marketing in Sri Lanka

  • Prof. DA Nimal Dharmasena
  • Dept. of Agric. Engineering, Faculty of Agriculture,

University of Peradeniya.

  • Dr. KH Sarananda

Agriculture Enterprise Development and Information Service, Department of Agriculture, Peradeniya

Sri Lankan Agriculture and Food security in a Nut Shell

  • An agriculture based country
  • Agriculture contribution to GDP 11.9% in 2010
  • One third of the employment is also in the

agricultural sector.

  • Present vegetable consumption is 94g/day

(34kg/year) need to be increased at least to 80kg per year (225g/day).

  • Present fruit consumption is 30g/day

(11kg/year) need to be increased >40kg

  • Population- 20.8 million
  • Estimated fresh fruit requirement - 995,712 t,

(assuming 20% wastage)

  • Fruit and vegetable cultivation: 20% of the

agricultural lands

  • Very high special variability of agro-ecology: 46 agro-

ecological zones.

  • Types of fruits and vegetables produce:

– Tropical: mainly in the Low country dry zone (2/3rd

  • f the country).

– Temperate: Mainly in the upcountry wet zone

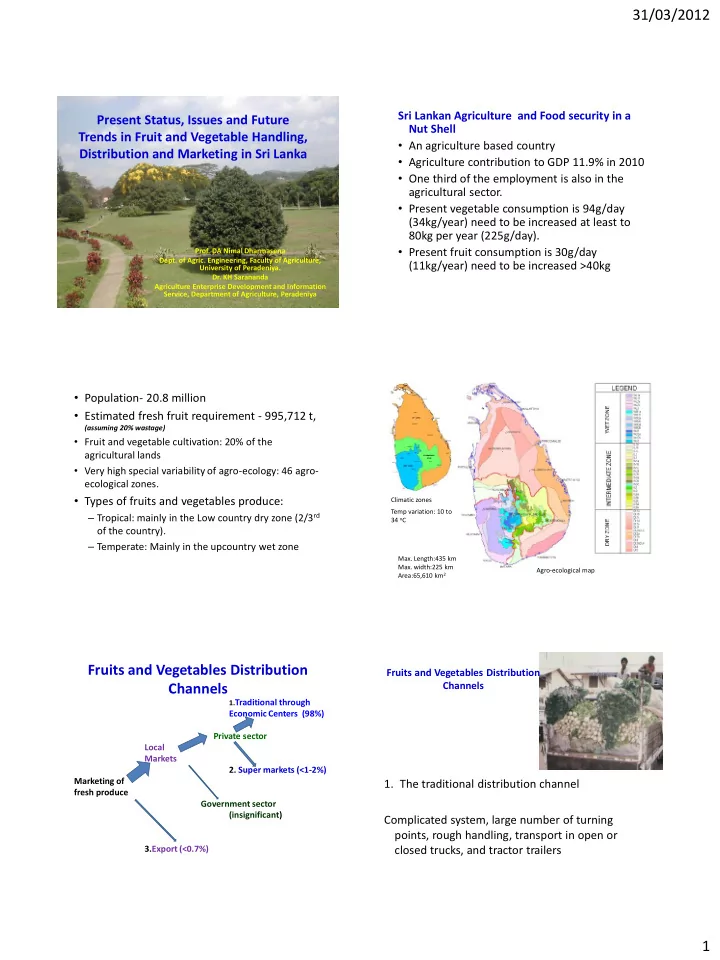
Climatic zones Agro-ecological map

  • Max. Length:435 km
  • Max. width:225 km

Area:65,610 km2 Temp variation: 10 to 34 oC

Fruits and Vegetables Distribution Channels

1.Traditional through

Economic Centers (98%) Private sector Local Markets

  • 2. Super markets (<1-2%)

Marketing of fresh produce Government sector (insignificant) 3.Export (<0.7%)

Fruits and Vegetables Distribution Channels

  • 1. The traditional distribution channel

Complicated system, large number of turning points, rough handling, transport in open or closed trucks, and tractor trailers

slide-2
SLIDE 2

31/03/2012 2

Farmer Middleman/Middlemen Economic Center (EC) Middleman/men Retailer consumer

EC

  • There is no proper pricing system
  • Wholesalers get-to-gether and

decide the price If supply is in excess:

  • Very low price
  • Very high Postharvest losses

No temporary storage facilities

  • There are twelve Economic Centers established

in the country

  • But only three are running at their full capacity

The main Economic Center at Dambulla handles about 4,000 t per day. Poor postharvest Management in the Economic center – video clip

  • 2. Major supermarket chains (03)

Farmer Collection center [Cold Storage] Transport in cold trucks Supermarket outlet Consumer Present status of postharvest losses

Average losses of fruits and vegetables under traditional distribution chain – 30-40%

Stepwise Postharvest Losses of Produce Throughout the Handling Chain (Sarananda, 2005)

Postharvest Loss Crop Producer Collector Wholesaler Retailer Total Fruits Banana

2 4 8 6 20

Papaya

6 10 20 10 46

Pineapple

2 4 8 4 18

Lime

4 8 16 12 40

Avocado

2 12 5 22 41

Vegetables Producer Collector Wholesaler Retailer Total Beans

4 6 13 7 30

Carrot

3 6 12 4 25

Leeks

5 6 12 7 30

Cabbage

4 7 9 5 25

Tomato

5 10 15 10 40

Okra

3 10 13 20 46

Eggplant

2 5 6 7 20

Capsicum

6 7 10 12 35

Contd.

Tomato from farm gate to wholesale Colombo (direct transportation -27% (Dharmasena, 2009).

slide-3
SLIDE 3

31/03/2012 3

  • 2. Supermarket chains:

Have cold chains and loss is very low 2-6% (Perera et. al.,

2004; Abeysekara, (undated))

  • Supermarket chains maintain relatively high quality but

the cost of handling is 50% greater than the traditional distribution (Abeysekara, (undated).

  • Prices 15-25% higher
  • Due to cost limitations, the supermarket chains are not

very much interested in running vegetable stalls.

  • They maintain it to increase the availability of items for

their customers. (Perera et. al., 2004)

  • Still the supermarket chains satisfy a minimum

share of about 1-2% of the fresh fruit and vegetable supply of the country due to poor purchasing power of clients at present.

  • Supermarket outlets are available only in city

centers. Urban population is about 15.1%

  • Per capita income at present US$ 2399.

Projected to be increased to 4000 by 2015.

  • Farmers are getting 20% more income in the

supermarket chains than traditional chains due to direct purchase, skipping the middleman (Abeysekara, (undated).

  • Minimize the waste after harvest to a

significantly low level, make more food available for human consumption.

3 Export distribution chain

The export demand cannot be supplied due to;

  • Poor quality -Poor pre and postharvest handling practices
  • No continuous supply
  • High cost of production

Wholesale market Sorting Exporter Export Good quality produce purchased from the farmer Farmer Farmer Farmer Farmer Collector Exporter

Selected farmers produce high quality produce Production is collected by a collector Transported on the same day Sorting and grading is done Air freight transportation Mainly to Maldives and Middle East countries

In Export channels more controlled at each step Farmer: Maturity is controlled Collected to a rigid container Collector: Transport in plastic crates Temperature controlled ?? Transport early as possible

slide-4
SLIDE 4

31/03/2012 4

Comparison of four distribution chains

Parameter

  • Tradi. chain

Government Exporter chain Supmkt. assisted chain Chain Price very low reasonable high high Quality of very low moderate very high high produce PH loss 30%-40% 10%-20% 5%-10% 2-6% PH diseases very high Moderate very low low Consumer very low moderate very high high satisfaction

Fruit and vegetable Imports and Exports

Vegetable Fruit Year

  • Impt. Qty(t)
  • Export. Qty (t)
  • Impt. Quantity (t)
  • Export. Qty (t)

2007 126,445 12,487 24635 11792 2008 237,675 19,398 26734 14415 2009 396,057 14,863 44795 13097 2010 500,482 11,528 51765 15809 551,084 55473

Future challenges in the fruit and vegetable postharvest sector

  • Reduction of present postharvest losses
  • Improvement of postharvest handling systems
  • Introduction of quality management
  • Improvement of safety standards
  • Promotion of export through better postharvest

management

  • Management of surplus production
  • Changing consumption to frozen or preserved forms
  • Promotion of functional foods for improved health
  • Production and postharvest Mgt. under climate change

Thank ank you

  • Average temperature
  • Dry zone → 28 0C
  • Intermediate zone → 24 - 26 0C
  • Wet zone → 24 0C
  • Average Rainfall
  • Dry zone → < 1,750 mm
  • Intermediate zone → 1,750-2,500 mm
  • Wet zone → > 2,500 mm

U- Up country (>1200m amsl) T:10-27 oC M- Mid country (600-1200m amsl) T:19-30 oC L- Low country (<600m amsl) T:21-34 oC C Locations of economic centers