
SLIDE 1
6/21/17 1
Public Health in Active Transportation Projects
Presented at the Active Transportation Projects Workshop June 7, 2017
Sharon Minnick, MS, PhD Epidemiologist Tulare County Public Health Healthy Lives,
Thriving Communities
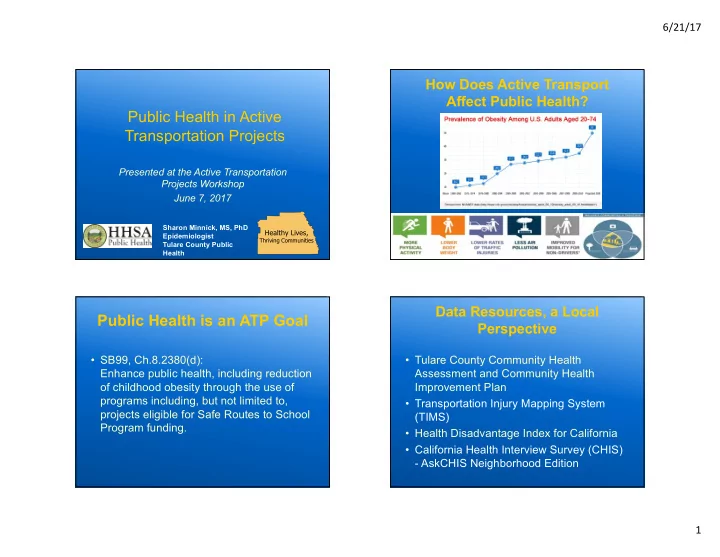
How Does Active Transport Affect Public Health?
Public Health is an ATP Goal
- SB99, Ch.8.2380(d):
Enhance public health, including reduction
- f childhood obesity through the use of
programs including, but not limited to, projects eligible for Safe Routes to School Program funding.
Data Resources, a Local Perspective
- Tulare County Community Health
Assessment and Community Health Improvement Plan
- Transportation Injury Mapping System
(TIMS)
- Health Disadvantage Index for California
- California Health Interview Survey (CHIS)
- AskCHIS Neighborhood Edition