
University of British Columbia CPSC 314 Computer Graphics Jan-Apr 2008 Tamara Munzner http://www.ugrad.cs.ubc.ca/~cs314/Vjan2008
Color II, Lighting/Shading I Week 7, Mon Feb 25
2News
- I’m back!
- including office hours Wed/Fri after lecture in lab
- this week
- Fri 2/29: Homework 2 due 1pm sharp
- Fri 2/29: Project 2 due 6pm
- extra TA office hours in lab this week to
answer questions
- Tue 2-4 (usual lab 1-2)
- Thu 2-4 (usual lab 10-11)
- Fri 2-4 (usual lab 12-1)
- reminder: midterm next Fri Mar 7
News
- Homework 1 returned today
- average 84
- Project 1 face-to-face grading done
- average 96
- stragglers contact Cody, cjrobson@cs, ASAP
- penalty for noshows, nosignups
- the glorious P1 Hall of Fame!
Review: Trichromacy and Metamers
- three types of cones
- color is combination
- f cone stimuli
- metamer: identically
perceived color caused by very different spectra
5Review: Measured vs. CIE Color Spaces
- measured basis
- monochromatic lights
- physical observations
- negative lobes
- transformed basis
- “imaginary” lights
- all positive, unit area
- Y is luminance, no hue
- X, Z hue, no luminance
CIE Gamut and λ Chromaticity Diagram
- 3D gamut
- chromaticity diagram
- hue only, no intensity
CIE “Horseshoe” Diagram Facts
- all visible colors lie inside the horseshoe
- result from color matching experiments
- spectral (monochromatic) colors lie around
the border
- the straight line between blue and red contains
the purple tones
- colors combine linearly (i.e. along lines), since
the xy-plane is a plane from a linear space
8CIE “Horseshoe” Diagram Facts
- a point C can be chosen as a white point
corresponding to an illuminant
- usually this point is of the curve swept out by the
black body radiation spectra for different temperatures
- relative to C, two colors are called complementary if
they are located along a line segment through C, but
- n opposite sides (i.e C is an affine combination of
the two colors)
- the dominant wavelength of the color is found by
extending the line from C through the color to the edge of the diagram
- some colors (i.e. purples) do not have a dominant
wavelength, but their complementary color does
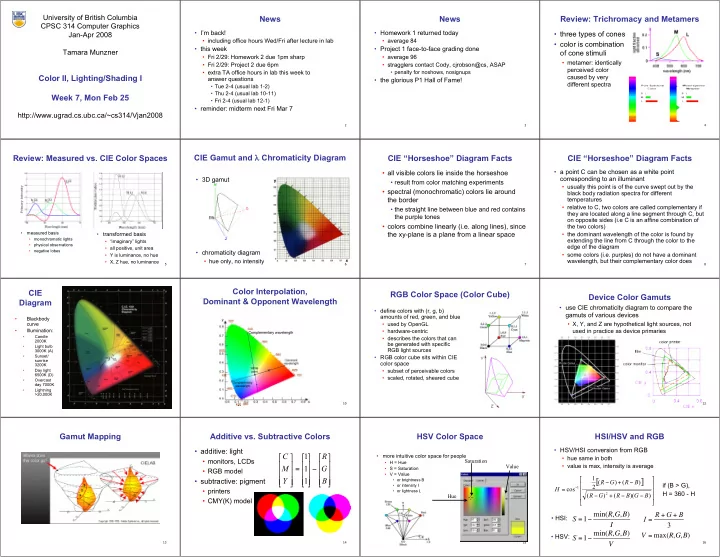
9CIE Diagram
- Blackbody
curve
- Illumination:
- Candle
2000K
- Light bulb
3000K (A)
- Sunset/
sunrise 3200K
- Day light
6500K (D)
- Overcast
day 7000K
- Lightning
>20,000K
10Color Interpolation, Dominant & Opponent Wavelength
Complementary wavelength Complementary wavelength 11RGB Color Space (Color Cube)
- define colors with (r, g, b)
amounts of red, green, and blue
- used by OpenGL
- hardware-centric
- describes the colors that can
be generated with specific RGB light sources
- RGB color cube sits within CIE
color space
- subset of perceivable colors
- scaled, rotated, sheared cube
Device Color Gamuts
- use CIE chromaticity diagram to compare the
gamuts of various devices
- X, Y, and Z are hypothetical light sources, not
used in practice as device primaries
13Gamut Mapping
14Additive vs. Subtractive Colors
- additive: light
- monitors, LCDs
- RGB model
- subtractive: pigment
- printers
- CMY(K) model
- =
- B
G R Y M C 1 1 1
15HSV Color Space
- more intuitive color space for people
- H = Hue
- S = Saturation
- V = Value
- or brightness B
- or intensity I
- or lightness L
Value Saturation Hue
16S =1 min(R,G,B) I
HSI/HSV and RGB
- HSV/HSI conversion from RGB
- hue same in both
- value is max, intensity is average
3 B G R I + + =
[ ]
- +
- +
- =
- )
)( ( ) ( ) ( ) ( 2 1 cos
2 1
B G B R G R B R G R H
V = max(R,G,B) S =1 min(R,G,B) V
- HSI:
- HSV:
if (B > G), H = 360 - H