
SLIDE 1
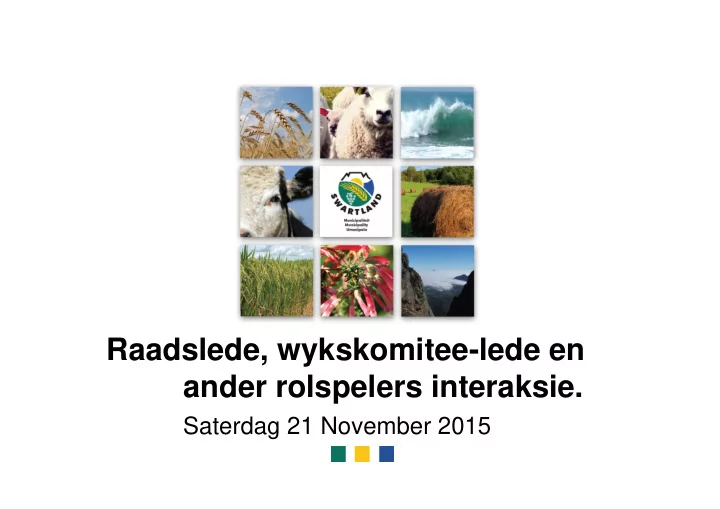
Raadslede, wykskomitee-lede en ander rolspelers interaksie.
Saterdag 21 November 2015
Raadslede, wykskomitee-lede en ander rolspelers interaksie. - - PowerPoint PPT Presentation
Raadslede, wykskomitee-lede en ander rolspelers interaksie. Saterdag 21 November 2015 Klinte-tevredenheidsopname Deel 1 Aantal responses ontvang Dorp Totaal 2011 Bevolking % Abbotsdale 21 3762 0.56% Chatsworth 27 2326 1.16%
Saterdag 21 November 2015
Kliënte-tevredenheidsopname
Deel 1
Aantal responses ontvang
Dorp Totaal 2011 Bevolking % Abbotsdale 21 3762 0.56% Chatsworth 27 2326 1.16% Darling 81 10420 0.78% Grottobaai / Jakkalsfontein 2 220 0.91% Kalbaskraal 14 2411 0.58% Koringberg 5 1214 0.41% Malmesbury 138 10365 1.33% Malmesbury - Ilinge Lethu 75 13671 0.55% Malmesbury - Wesbank / Saamstaan 65 11861 0.55% Moorreesburg 99 7760 1.28% Moorreesburg - Rosenhof 43 5117 0.84% Moorreesburg - Sibanya 2 Ongegund 4 255 1.57% Riebeek-Kasteel 25 1144 2.19% Riebeek-Kasteel - Esterhof 20 3617 0.55% Riebeek-Wes 51 4350 1.17% Riverlands 14 1726 0.81% Ruststasie 1 Yzerfontein 87 1140 7.63% Nie-stedelik 9 32404 0.03% Totaal
783
113763 0.69%
Vorige opname - 348
Oorhoofse resultate
Oorhoofse resultate
Elektrisiteit
1 Spoed waarteen nuwe aansluitings gedoen word, meters vervang word Tevredenheidsvlak Satisfaction level Ontevrede Not satisfied Neutraal Neutral Tevrede Satisfied 8.8% 31.9% 59.3%
Elektrisiteit
2 Spoed waarteen onderbrekings herstel word, kennisgewings rakende onderbrekings gegee word, ens. Tevredenheidsvlak Satisfaction level Ontevrede Not satisfied Neutraal Neutral Tevrede Satisfied 9.1% 28.7% 62.2%
Verligting van strate
Onderhoud / herstel van ligte Tevredenheidsvlak Satisfaction level Ontevrede Not satisfied Neutraal Neutral Tevrede Satisfied 13.7% 29.7% 56.6%
Water
1 Spoed waarteen nuwe aansluitings gedoen word Tevredenheidsvlak Satisfaction level Ontevrede Not satisfied Neutraal Neutral Tevrede Satisfied 6.3% 33.1% 60.6%
Water
2 Spoed waarteen meters vervang word, beskadige pype herstel word, ens. Tevredenheidsvlak Satisfaction level Ontevrede Not satisfied Neutraal Neutral Tevrede Satisfied 7.8% 32.0% 60.2%
Riolering
1 Spoed waarteen nuwe aansluitings gedoen word Tevredenheidsvlak Satisfaction level Ontevrede Not satisfied Neutraal Neutral Tevrede Satisfied 6.3% 38.9% 54.8%
Riolering
2 Spoed waarteen verstoppings herstel word Tevredenheidsvlak Satisfaction level Ontevrede Not satisfied Neutraal Neutral Tevrede Satisfied 6.7% 34.5% 58.8%
Riolering
3 Spoed waarteen riooltenks uitgesuig word Tevredenheidsvlak Satisfaction level Ontevrede Not satisfied Neutraal Neutral Tevrede Satisfied 7.1% 34.3% 58.6%
Vullisverw ydering
1 Verwydering van huishoudelike vullis, tuinvullis Tevredenheidsvlak Satisfaction level Ontevrede Not satisfied Neutraal Neutral Tevrede Satisfied 4.8% 15.2% 80.0%
Vullisverw ydering
2 Straatvullisdromme, skoonhou van strate Tevredenheidsvlak Satisfaction level Ontevrede Not satisfied Neutraal Neutral Tevrede Satisfied 13.9% 24.4% 61.7%
Strate en sypaadjies
1 Herstel van slaggate, teer en herseëling Tevredenheidsvlak Satisfaction level Ontevrede Not satisfied Neutraal Neutral Tevrede Satisfied 35.7% 35.0% 29.3%
Strate en sypaadjies
2 Onderhoud van gruispaaie Tevredenheidsvlak Satisfaction level Ontevrede Not satisfied Neutraal Neutral Tevrede Satisfied 31.1% 40.3% 28.6%
Strate en sypaadjies
3 Skoonmaak van sypaadjies, spuit van onkruiddoder Tevredenheidsvlak Satisfaction level Ontevrede Not satisfied Neutraal Neutral Tevrede Satisfied 36.0% 34.0% 30.0%
Stormw ater
Instandhouding en skoonmaak van die stormwaterstelsel Tevredenheidsvlak Satisfaction level Ontevrede Not satisfied Neutraal Neutral Tevrede Satisfied 18.4% 43.2% 38.5%
Munisipale begraafplase
Instandhouding en skoonmaak Tevredenheidsvlak Satisfaction level Ontevrede Not satisfied Neutraal Neutral Tevrede Satisfied 30.3% 41.4% 28.3%
Sportvelde
Voorbereiding en instandhouding, bv. sny van gras, uitmerk van speeloppervlakte Tevredenheidsvlak Satisfaction level Ontevrede Not satisfied Neutraal Neutral Tevrede Satisfied 17.2% 37.7% 45.0%
Munisipale sw embaddens
Instandhouding Tevredenheidsvlak Satisfaction level Ontevrede Not satisfied Neutraal Neutral Tevrede Satisfied 7.3% 35.3% 57.4%
Parke en tuine
Instandhouding, bv. sny van gras, snoei van bome en struike, instandhouding van speeltoerusting Tevredenheidsvlak Satisfaction level Ontevrede Not satisfied Neutraal Neutral Tevrede Satisfied 22.3% 39.6% 38.1%
Brandw eer en nooddienste
Evaluering Tevredenheidsvlak Satisfaction level Ontevrede Not satisfied Neutraal Neutral Tevrede Satisfied 13.8% 39.7% 46.5%
Verkeer- en w etstoepassingsdienste
Evaluering Tevredenheidsvlak Satisfaction level Ontevrede Not satisfied Neutraal Neutral Tevrede Satisfied 19.4% 36.8% 43.8%
Motorregistrasies- en lisensies
Evaluering Tevredenheidsvlak Satisfaction level Ontevrede Not satisfied Neutraal Neutral Tevrede Satisfied 4.7% 22.8% 72.5%
Biblioteke
Evaluering Tevredenheidsvlak Satisfaction level Ontevrede Not satisfied Neutraal Neutral Tevrede Satisfied 3.9% 12.2% 83.9%
Bouplanne
Goedkeuring van bouplanne Tevredenheidsvlak Satisfaction level Ontevrede Not satisfied Neutraal Neutral Tevrede Satisfied 11.0% 35.7% 53.3%
RED TAPE REDUCTION CONFERENCE 29 September 2014
Case study approval of building plans
Recent surveys comparing service delivery amongst different Municipalities have highlighted that the “approval of building plans”, as an area of service delivery that is not rated high in many Municipalities. Remember: Approval of Building Plans only rated at 3,5
Financial Year Total building plans In benchmark (30 days) Out of benchmark Total days
2009/2010 622 267 355 73
2010/2011 701 449 252 45 2011/2012 783 723 60
27
2012/2013 711 711 18
2013/2014 691 691
13
Jul/Aug 2014 111 111
BUILDING CONTROL OUTCOME FOR LAST 5 (FIVE) FINANCIAL YEARS
Financial Year Total building plans In benchmark (30 days) Out of benchmark Total days
2009/2010 622 267 355 73
2010/2011 701 449 252 45 2011/2012 783 723 60
27
2012/2013 711 711 18
2013/2014 691 691
13
Jul/Aug 2014 111 111
BUILDING CONTROL OUTCOME FOR LAST 5 (FIVE) FINANCIAL YEARS
We had the desire to get this figure down to less than two weeks, so we implemented additional processes to improve, which led to a “PRE‐ TOWN PLANNING SRUTINY “ meeting.
Bouw erke
Uitvoering van bou-inspeksies Tevredenheidsvlak Satisfaction level Ontevrede Not satisfied Neutraal Neutral Tevrede Satisfied 13.4% 36.4% 50.2%
Munisipale rekeninge
Hantering van navrae, korrektheid van regstelllings, tydige uitstuur van rekeninge, ens. Tevredenheidsvlak Satisfaction level Ontevrede Not satisfied Neutraal Neutral Tevrede Satisfied 7.0% 20.0% 73.0%
Weet u w ie u w yksraadslid is?
Weet u w ie op u w ykskomitee dien?
Wykskomitee funksionering
Effektiwiteit en funksionering van u wykskomitee Tevredenheidsvlak Satisfaction level Ontevrede Not satisfied Neutraal Neutral Tevrede Satisfied 34.3% 41.4% 24.2%
Hoe gereeld skakel u met 'n munisipale kantoor?
1 'n Plaaslike kantoor anders as Malmesbury Bykans nooit en Af en toe = 74.1%
Hoe gereeld skakel u met 'n munisipale kantoor?
2 Malmesbury kantoor Bykans nooit en Af en toe = 80,2%
Hoe w as die diens by die plaaslike kantoor ten opsigte van die volgende?
1 Hantering van algemene navrae (skriftelik, telefonies of in persoon gerig) Tevredenheidsvlak Satisfaction level Ontevrede Not satisfied Neutraal Neutral Tevrede Satisfied 4.3% 22.2% 73.6%
Hoe w as die diens by die plaaslike kantoor ten opsigte van die volgende?
2 Telefoonetiket Tevredenheidsvlak Satisfaction level Ontevrede Not satisfied Neutraal Neutral Tevrede Satisfied 4.4% 21.2% 74.5%
Hoe w as die diens by die plaaslike kantoor ten opsigte van die volgende?
3 Vriendelikheid en hulpvaardigheid van personeel Tevredenheidsvlak Satisfaction level Ontevrede Not satisfied Neutraal Neutral Tevrede Satisfied 4.8% 18.7% 76.5%
Hoe w as die diens by die plaaslike kantoor ten opsigte van die volgende?
4 Kennis en vaardigheid van personeel Tevredenheidsvlak Satisfaction level Ontevrede Not satisfied Neutraal Neutral Tevrede Satisfied 4.5% 20.3% 75.2%
Hoe w as die diens by die Malmesbury kantoor ten opsigte van die volgende?
1 Hantering van algemene navrae (skriftelik, telefonies of in persoon gerig) Tevredenheidsvlak Satisfaction level Ontevrede Not satisfied Neutraal Neutral Tevrede Satisfied 7.4% 26.3% 66.3%
Hoe w as die diens by die Malmesbury kantoor ten opsigte van die volgende?
2 Telefoonetiket Tevredenheidsvlak Satisfaction level Ontevrede Not satisfied Neutraal Neutral Tevrede Satisfied 4.9% 27.7% 67.4%
Hoe w as die diens by die Malmesbury kantoor ten opsigte van die volgende?
3 Vriendelikheid en hulpvaardigheid van personeel Tevredenheidsvlak Satisfaction level Ontevrede Not satisfied Neutraal Neutral Tevrede Satisfied 6.6% 24.9% 68.6%
Hoe w as die diens by die Malmesbury kantoor ten opsigte van die volgende?
4 Kennis en vaardigheid van personeel Tevredenheidsvlak Satisfaction level Ontevrede Not satisfied Neutraal Neutral Tevrede Satisfied 7.9% 26.8% 65.3%
Hoe beoordeel u die kommunikasie van die Munisipaliteit met belastingbetalers?
Tevredenheidsvlak Satisfaction level Ontevrede Not satisfied Neutraal Neutral Tevrede Satisfied 11.9% 42.4% 45.7%
Watter van die volgende gee vir u die beste inligting rakende die Munisipaliteit?
Veronderstel u wil meer oor die Munisipaliteit se dienste uitvind, waar sal u vir inligting soek?
Deur watter medium sou u verkies dat die Munisipaliteit met u kommunikeer?
Terugblik op die onlangse GOP- en Begrotings publieke deelname vergaderings
Wat is ons visie, missie, w aardestelsel en leierskaps filosofie
Onthou u dit nog?
Missie Swartland Munisipaliteit poog om sosiale en ekonomiese stabiliteit en groei te bewerkstellig deur volhoubare lewering van primêre en sekondêre dienste aan al ons belangegroepe Mission At Swartland Municipality it is our mission to promote social and economic stability and growth through the sustainable delivery of services in terms of our legal powers and functions to all interested parties Vision Swartland Municipality is a frontline
development and delivers services effectively and efficiently to all its people by building partnerships with all stakeholders Visie
Swartland Munisipaliteit is ‘n toonaangewende organisasie wat volhoubare ontwikkeling bevorder en dienste effektief en doeltreffend aan al sy mense lewer deur vennootskappe met alle belanghebbendes te bou
ity
ity and Commitme nt
t
k in har mony
Wat word bedoel met die term “WHOLE SOCIETY APPROACH”
Wat sê die mense van SM na die publieke deelname?
Paul Kruger.
Wat verwag ons van leierskap en bestuur en watter drie eienskappe moet ons oor beskik?. Daar is baie, maar die volgende drie is vir my belangrik, synde:
Wat sê die mense van JOU?
Goeie oordeel kan nie geleer, gekoop of uitgekontrakteer word nie, dit word met verloop van tyd
Waaroor het die vergaderings eintlik gegaan?
en die Begroting nie.
kommunikeer/praat.
wat dit tans gedoen word, nie meer effektief is nie en nie tred gehou het met die veranderinge nie.
dat daar n probleem is.
Wat is ons w aarnemings?
Skryf elkeen asb EEN waarneming neer, wat u ervaar het of wat u gewaarwording was, gebasser op die interaksies waar u teenwoordig was. In watter areas/dorpe/wyke was daar die minste probleme?:
Wat van die ander plekke? – hoekom voel hulle so en hoekom reageer hulle so?
Hulle voel vernalatig. Miskien is dit n verkeerde persepsie, maar die feit is dat dit wel die geval is, pesepsie of te nie?.
The trouble with performance management…
Why aren’t you working? I didn’t see you coming! 59
Are our Performances artificial or is it the REAL thing?
Sustainable Value Short Term Results Short Term Results Cosy Environment
Performance Management:
“Dead fish in the water”
“Leadership determines the level of sustainable performance” Organisational Focus Operational Focus
High High LOW SDBIB SDBIB Risk Man’t Risk Man’t IDP Budget Budget
“back to basics”
Wat is die B2B konsep van die Nasionale Minister?
interruption
Is hierdie B2B voldoende???????? Met resepek, ek dink nie so nie.
Hoe maak ons dit reg?
Deur te erken dat daar n probleem is en om die uitdagings saam aan te pak. Dit help nie raadslede, oftewel die wyksraadslede pak die skuld op die administrasie, of vice versa nie. Ek sal later met n gedagte hieroor kom, maar eers agtergrond oor wat besig is om te gebeur in ons wêreld.
What is happening to our brains and
Our intellect: Our mental architecture is awesome in capability, but fundamentally limited. We should not, as well as cannot, put all the information in our heads. Learning is a process of practise and reflection, but instruction is: “designed practise and guided reflection” We need deep and meaning- ful practise/interaction Our organisations: Plan, prepare and execute:‐ that world is gone. Our era is one of:‐ continual change, great challenges, shifting context and unique situations. Ability to be more agile while maintaining resilience is a necessity. Continual innovation is required. Develop the ability to solve unique problems (immediately) and develop new products and solutions
What is Public Sector Innovation (PSI?)
Karakter eienskappe
Introduce new approaches, relative to the changing context
new way of doing things:- must be implemented and not just an idea
better public relations, enhancing efficiency and effectiveness Organisational attributes influencing PSI?
ideas
design.
So w at nou?
Wat gebeur in ons gebied/Provinsie en die wereld? Hoe sal jy jou veranderde omgewing beskryf, hetsy:
Spreek ons die uitdagings en veranderde konteks, suksesvol aan? How do we manage the change in this ever changing environment?.
Demanding Citizen Competition for investment Budgetary Austerity Blurring Boundaries Pervasiveness of technology Demographic change
Global uncertainty “Underlying all these risks are velocity, multiplicity and interconnectivity – creating a global system where mastering complexities will be the foremost challenge” ‐‐ Klaus Schwab: Chairman of the World Economic Forum
Veeleisende Inwoners Kompetisie vir be- legging/spander. Begroting “soberheid” Nie duidelike grense nie Beskikbaarheid van tegnologie Demografiese veranderinge
Globale onsekerheid “Onderliggend tot al hierdie risikos is spoed (snelheid), hoeveelheid en inter aansluitbaarheid – wat n globale sisteem skep, waar die hantering van multi‐ dissiplinêre komplekse aspekte, die grootste uitdaging is ” ‐‐ Klaus Schwab: Chairman of the World Economic Forum
FUTURE OF GOVERMENT SWARTLAND MUNICIPALITY ?
Citizen as a : Customer Partner Collaborator Co‐producer Citizen’s Jury / Citizen compass
INTERNAL – EXTERNAL BALANCE
External Control
STRATEGIC IMPLEMENTATION Arena for efficient processes and effective services New strategic playground for growth and development across sectors ORGANISATION TERRITORY
Maintaining the balance between internal and external focus
PRINCIPLES FOR GOOD GOVERNANCE AT
SWARTLAND MUNICIPALITY
THE FUTURE OF LOCAL GOVERNMENT
Tomorrows leading public body…
SM se Visie SM se Missie Vision & Mission
CITIZEN-CENTRIC SUSTAINABLE OUTCOMES INTERNAL – EXTERNAL BALANCE TRANSPARENT Creating the society
Citizens of Tomorrow, ‐‐ Today – be a Trusted, Sustainable and Collaborating Government Economical, Sustainable “Good Growth” as an
The lenses Key characteristics Swartland Municipality is a frontline organisation which promotes sustainable development and delivers services effectively and efficiently to all its people by building partnerships with all stakeholders To promote social and economic stability and growth through the sustainable delivery of services in terms of our legal powers and functions to all
TRANSPARENT
THE “FUTURE” LEADING PUBLIC BODY / SM
Projecting and creating the society of the future Political purpose
Internal Stakeholders Intelligence scanning External Stakeholders
CONNECTED AGILITY INNOVATIVE
Leadership Smart funding financial management Talent management Partnering & networking Service description & delivery Prioritisation planning Program project & risk management PMS and
assessment Rapid prototyping
INTERNAL- EXTERNAL BALANCE
SUSTAINABLE OUTPUTS IMPACT
V I S S I O N
OUTCOMES OUTCOMES SUCCESSFUL EXECUTION CITIZEN-CENTRIC The lenses Key characteristics Internal management capabilities
Ervaring van die publieke deelname
Kom ons plaas die “politiekery” ter syde, wat was jou enkele grootste gewaarwording/ervaring van die
Kyk weereens na die EEN ding wat jy neergeskryf het! Wat dink jy is die oplossing? Dit help nie die administrasie plaas die blaam op die wyksraadslid en vice versa nie, want dit gaan nie die probleem oplos nie. Ons suksesse van gister, verseker nie ons sukses vir die toekoms nie. Ons gesentraliseerde diensleweringsmodel voldoen nie meer aan die veranderende konteks en verwagtings nie As ons dit nie kon “aanvoel” nie, dan moet ons nie poste bekleë wat ons tans bekleë nie
….. vervolg
Ons raak afgestomp van wat daar buitte aangaan en wat die werklike behoeftes is. Alles gaan nie net oor geld en investering nie, maar dit is n bestuursuitdaging. Die persepsie van baie van die areas is dat hulle voel dat hulle “vernalatig” is/word. As raadslede an amptenare plaas ons, sonder dat ons dit so bedoel, die verantwoordelikheid oor van die een na die ander. …….nou gebeur daar niks, of sekere goed bly in gebreke Die mense wil iemand hê – bo en behalwe die wyksraadslid – om mee te praat, voel dat n persoon wat “dedicated” is na hulle belange sal omsien, saam met hulle raadslid. Hoe stel ons voormelde reg met n “toe beursie”?
Pre pa re d b y Dire c to ra te : Re se a rc h & K no wle dg e Ma na g e me nt No ve mb e r 2015
DAT A SOURCE S USE D c ontinue d
Othe r data sour c e s use d:
fo c us g ro up disc ussio ns
ic an 18+ ye ar s
n a ll 9 pr
c ate gor ie s.
ie ldwo rk c o nduc te d 10 Se pte mbe r
2015
al House hold Sur ve y (GHS)
e pr e se ntative c e nsus a nd ho use ho ld
study c o nduc te d b y Sta tsSA.
ic an Audie nc e Re se ar c h F
Me dia Pr
ve y (SAARF AMPS)
e se ar c h c o nduc te d na tio na lly twic e a ye a r sinc e 1998.
nc lude s a ll individua ls 15 ye a rs a nd o lde r. Sc ie ntific a lly dra wn, multi-sta g e , a re a stra tifie d, pro b a b ility sa mple is ta ke n to re pre se nt the po pula tio n o f So uth Afric a .
WE ST E RN CAPE : E ASY ST AT IST ICS
Source: Stats SA 2015 Mid‐year population estimates & Stats SA Quarterly Labour Force Survey Q2:2015
TOTAL POPULATION:
6.2 MILLION = 11,3% OF SOUTH AFRICA FEMALE: 3 145 256 (50,7%) MALE: 3 054 841 (49,3%) AGE: < 15yrs = 26% 35-59yrs = 30% 15-34yrs = 34% > 60+yrs = 9%
po pula tio n live in We ste rn Ca pe .
third
We ste rn Ca pe is ma de up o f ‘youth’.
LANGUAGE: 49,7% AFRIKAANS 24,7% ISIXHOSA 20,3% ENGLISH UNEMPLOYMENT RATE: NATIONAL: 25,0 % WESTERN CAPE: 21,7%
Public Opinion – We ste r n Cape vie ws L
nme nt – We ste r n Cape vie ws
MOST RESPONSIBL E:
GOVERNMENT / PRESIDENT
T OP 3 CHAL L ENGES:
69%
Une mployme nt
52%
Crime
24%
Cor r uption T RUST DOING WEL L
Re po rting o n to p 2 b o x %
Be st Pe rforming Are a
Re po rting o n % me ntio ns
Cle an Dr inking Wate r
71%
Inc luding/ c o nsulting 45%
Worst Pe rforming Are a
BECOME AWARE T HROUGH:
AT T END COMMUNIT Y MEET ING
30%
L
Haile r
26%
F lye r s
All Ye s re spo nse s
RE SUL T S DASHBOARD: KE Y INDICAT ORS
So urc e : GCI S T ra c ke r Aug -Se pt 2015 RIGHT DIRECT ION
37%
Quality o f Ele c tr ic ity 45%
(31% ) (39% ) (34% ) (48% )
Question: If you think of the direction in which the country is going, would you say that the country is going in the right direction or going in the wrong direction?
Source: GCIS National Tracker
WESTERN CAPE VIEW
point shows an even steeper increase in pessimism and the Western Cape is no different, even displaying slightly more pessimism than the national average.
up to local government elections this worrying negative trend should be monitored.
greatly to the negative sentiments.
NOTE: VIEWS OF WESTERN CAPE RESIDENTS COMPARED TO NATIONAL VIEWS.
66% 66%
WRO WRONG DIREC DIRECTION
25% 25%
RIG RIGHT DIREC DIRECTION
9% 9%
DON’T DON’T KNOW KNOW
PUBL IC OPINION: OVE RAL L COUNT RY DIRE CT ION
WE ST E RN CAPE OPINION- OVE RAL L COUNT RY DIRE CT ION
Question: What makes you say the country is going In the right/wrong direction? % % Question: Who do you think is responsible for the overall direction in which the country is going?
So urc e : GCI S T ra c ke r Aug -Se pt 2015
Source: GCIS National Tracker (Aug‐Sep15)
Question: In your opinion, what are the most important problems facing this country that government should address?
the greatest challenge across the country – affecting all levels of society.
residents are no different from the general national concerns. With housing as a concern having gone down substantially.
similar to what respondents deem as challenges facing the country.
NOTE THIS GAP!
PUBL IC OPINION: T OP 4 CHAL L E NGE S F ACING T HE COUNT RY
MOST IMPORTANT CHALLENGES ~ WESTERN CAPE VIEWS
UNEMPL OYMENT
69%
CRIME
52%
HOUSING
26%
CORRUPT ION
24%
"Une mplo yme nt is a hug e pro ble m. T he o lde r pe o ple g e t S AS S A pe nsio ns, but the re is no thing fo r the yo uth." (NC,Co lo ure d,Mixe d,18-24,L S M 1-6) "Co rruptio n in the allo c atio n o f ho using is the big g e st se rvic e de live ry pro ble m and is like ly to be the c ause
N,Blac k,mixe d,25-34,L S M 4-6)
HE ADL INE S ON WE ST E RN CAPE L OCAL GOVE RNME NT (JAN - OCT 2015)
So urc e : GCME Me dia Ana lysis (GCI S)
extent Oudtshoorn, Manenberg, the Penisula and Khayelitsha. The names of the Cape Town Mayor (De Lille) and the Western Cape Premier (Zille) were also prominently mentioned in relation to provincial local government matters.
rapid transport system; the tolling of roads, especially around Cape Town; services like electricity, water and housing; the Cape Minstrel Carnival dispute; and court action following protests in Cape Town.
Question: How well or badly do you feel that the Provincial government (the government sphere of this province) and Local government (your municipality) is doing its job?
SPHE RE S OF GOVE RNME NT : PE RF ORMANCE E VAL UAT ION
%
Sour c e : GCI
S Na tio na l T ra c ke r (Aug -Se p 2015)
MUNICIPAL IT IE S’ PE RF ORMANCE S
So urc e : Sta tsSA Ce nsus 2011
PERFORMANCE OF PERFORMANCE OF MUNICIPALITIES (2011) MUNICIPALITIES (2011)
Flush toilet connected to sewerage Weekly refuse removal Piped water inside dwelling Electricity for lighting City of Matlosana 93%
(North West)
Saldanha Bay 97%
(Western Cape)
Bergrivier 83%
(Western Cape)
Swartland 98%
(Western Cape)
Saldanha Bay 93%
(Western Cape)
Knysna 93%
(Western Cape)
Cape Agulhas 82%
(Western Cape)
Dr JS Moroka 98%
(Mpumalanga)
Drakenstein 90%
(Western Cape)
Mossel Bay 90%
(Western Cape)
Beufort West 81%
(Western Cape)
Cape Agulhas 98%
(Western Cape)
Kgatelopele 89%
(Northern Cape)
Govan Mbeki 92%
(Mpumalanga)
Hessequa 81%
(Western Cape)
Richtersveld 96%
(Northern Cape)
Govan Mbeki 89%
(Mpumalanga)
Kgatelopele 92%
(Northern Cape)
Swartland 81%
(Western Cape)
Molemole 96%
(Western Cape)
Nyandeni 2%
(Eastern Cape)
Moretele 1%
(North West)
Nyandeni 3%
(Eastern Cape)
Maphumulo 34%
(KwaZulu‐Natal)
Msinga 2%
(KwaZulu‐Natal)
Kagisano Molopo 1%
(North West)
Port St Johns 3%
(Eastern Cape)
Jozini 29%
(KwaZulu‐Natal)
Aganang 2%
(Limpopo)
Imbabazane 1%
(KwaZulu‐Natal)
Ntabakulu 3%
(Eastern Cape)
Msinga 25%
(KwaZulu‐Natal)
Mbizana 1 %
(Eastern Cape)
Ratlou 1%
(North West)
Intsika Yethu 2%
(Eastern Cape)
Ntabankulu 23%
(Eastern Cape)
Imbabazane 1%
(KwaZulu‐Natal)
Aganang 1%
(Limpopo)
Mbizana 2%
(Eastern Cape)
Umhlabuyalingana 14%
(KwaZulu‐Natal)
1 2 3 4 5 1 2 3 4 5
TOP 5 BOTTOM 5
(%) Percentage of households who receive the mentioned municipal services
Source: GCIS Tracker
% w ho rated perform ance on indicator as “fairly w ell” / “very w ell” % w ho rated perform ance on indicator as “very badly” / “fairly badly”
Most positive performing areas of government. These fall largely into the areas of health care, welfare and
viewed the most positively especially combating and treating HIV/AIDS and TB, as well as vaccines for children. Least positive performing areas of government are employment and economy related. Western Cape’s sentiments are more or less the same as national sentiments.
GE NE RAL PE RCE PT IONS OF GOVE RNME NT PE RF ORMANCE
6 2 %
NATIONAL VIEW WESTERN CAPE VIEW NATIONAL VIEW WESTERN CAPE VIEW
7 2 % 7 4 % 7 8 % 7 6 % 5 6 % 6 0 %
70%
E nsuring the re mo va l o f so lid wa ste
71%
Pro viding c le a n drinking wa te r to c o mmunitie s E nsuring a re lia b le supply o f e le c tric ity
45%
Question: How well or badly would you say your local government or municipality is handling each of the following matters?
I nc luding o r c o nsulting pe o ple in the lo c a l g o ve rnme nt pro c e ss
50% WESTERN CAPE VIEW 49%
L
gove r nme nt pe r for manc e
government services are perceived positively – in line with Stats SA reporting on progress in access to basic services. However, in the Western Cape it is ensuring a reliable supply of electricity and inclusion/consultation issues that come up as weak performance areas.
Sour c e : GCI
S Na tio na l T ra c ke r
PUBL IC OPINION: SOME L OCAL GOVE RNME NT PE RF ORMANCE INDICAT ORS
GENERAL HOUSEHOLD SURVEY 2002 2008 2014 Connected to mains electricity supply 77% 82% 86% Access to piped water 85% 89% 90% Household refuse removal 57% 60% 64%
POSSIBL E DRIVE RS OF POOR PUBL IC CONSUL T AT IONS & PE RCE IVE D CORRUPT ION
Source: GCIS National Qualitative Research (2014) “But e ve n c o ming do o r to do o r to find o ut what yo ur pro ble m is, the y do n’ t do it, it’ s o nly whe n it c o me s to e le c tio ns statio n.” (GP, Randfo nte n, 25-34, L S M 4-6) "Co unc illo r o nly c o me to the c o mmunity whe n the y want to te ll us what the y plan to do . I f the c o mmunity re que st and me e ting to c o me and ask abo ut ho w far the y are with pro je c ts, the y do n’ t c o me " (MP,Blac ks,mixe d,35+,L S M 4-6) “Our c o unc illo r is se ldo m ac c e ssible in o ur villag e yo u c o uld o nly se e him whe n the re is a burning issue , he is no t that frie ndly that yo u c an ac c e ss him" (L P,Blac k,mixe d,35+,L S M 7-10)
Inac c e ssible
T his is a skill pro ble m, and no e xpe rtise be c ause fo r many ye ars the y have a te le me tric syste m that do e s no t wo rk. T he re is no manag e me nt skill o r the will to fix the se issue s.” (NW, Ruste nburg , mixe d, White , 35+, Afrikaans. L S M 7-10) "I think that the c o unc illo rs do n’ t re ad the do c ume nts the y are pre se nte d with and the y are no t allo we d to ask que stio ns....it lo o ks like the y do n’ t que stio n thing s and the y just take the m as the y are ."(MP,Blac ks,mixe d,35+,L S M 4-6)
L ac k of skills and c apac ity
"T he pe o ple in the c o unc il have a say o ve r who g e ts appo inte d. Be c ause I be lie ve the re is ne po tism. I t is po litic ally mo tivate d." (L P,White ,mixe d, 25-34, L S M 7-10) "We have c o unc illo rs in the c o mmunity, but the y do n’ t c arry the inte re st o f the c o mmunity, the y are o nly c o nc e rne d abo ut the ir familie s. I f a jo b o ppo rtunity be c o me s available , the family is e mplo ye d."(NC,Co lo ure d,Mixe d,25-34, L S M 4-6)
Ne potism and c or r uption 50%
I nc luding o r c o nsulting pe o ple in the lo c a l g o ve rnme nt pro c e ss
WESTERN VIEW NATIONAL VIEW
49%
I nc luding o r c o nsulting pe o ple in the lo c a l g o ve rnme nt pro c e ss
MEDIA USE
Sour c e : SAARF
AMPS Ja n-De c 2014 & Ro o ts 2013
the Western Cape seven in ten people read some type of community newspaper.
% T
T V
97%
92%
Ra dio
87%
92%
Ne wspa pe r
60%
46%
Ma g a zine
62%
46%
Co mmunity Ra dio
38%
26%
Co mmunity T V
9%
11%
Co mmunity Ne wspa pe r
76%
66%
I nte rne t
49%
39%
ME SSAGE MAT RIX
PARTNERSHIPS
TOGETHER WE MOVE SA FORWARD
BASIC SE RVICE DE L IVE RY
bigger national communication campaign. This should be done taking into consideration that the period leading up to elections is normally contested which may influence service delivery protests.
PEOPLE MUST ‘FEEL’ CONSULTED IMPROVE COUNCILLOR COMMUNICATION DO THE BASICS & COMMUNICATE:
ELECTRICITY HOUSING
ENCOURAGE RESPONSIBLE CITIZENRY
Pho to g ra ph: Ministe rPra vin Go rdha n Ba c k to Ba sic s Pre se nta tio n – Se pte mb e r2014