Segmentation using Segmentation using Bayesian Decision Theory - - PDF document

segmentation using segmentation using bayesian decision
SMART_READER_LITE
LIVE PREVIEW

Segmentation using Segmentation using Bayesian Decision Theory - - PDF document

Segmentation Segmentation Segmentation using Segmentation using Bayesian Decision Theory Bayesian Decision Theory Segmentation of images is the separation of pixels into different categories depending upon their intensities and/or other


slide-1
SLIDE 1

Segmentation using Segmentation using Bayesian Decision Theory Bayesian Decision Theory

  • J. K. Aggarwal

The University of Texas at Austin Austin, TX 78712

2

Segmentation Segmentation

Segmentation of images is the separation of

pixels into different categories depending upon their intensities and/or other contextual

  • information. We will pose this problem as

Background Vs. Foreground

Segmentation process is fairly simple for black

and white or gray scale images, using a “threshold” one is able separate the foreground from the background.

3

Example Example

4

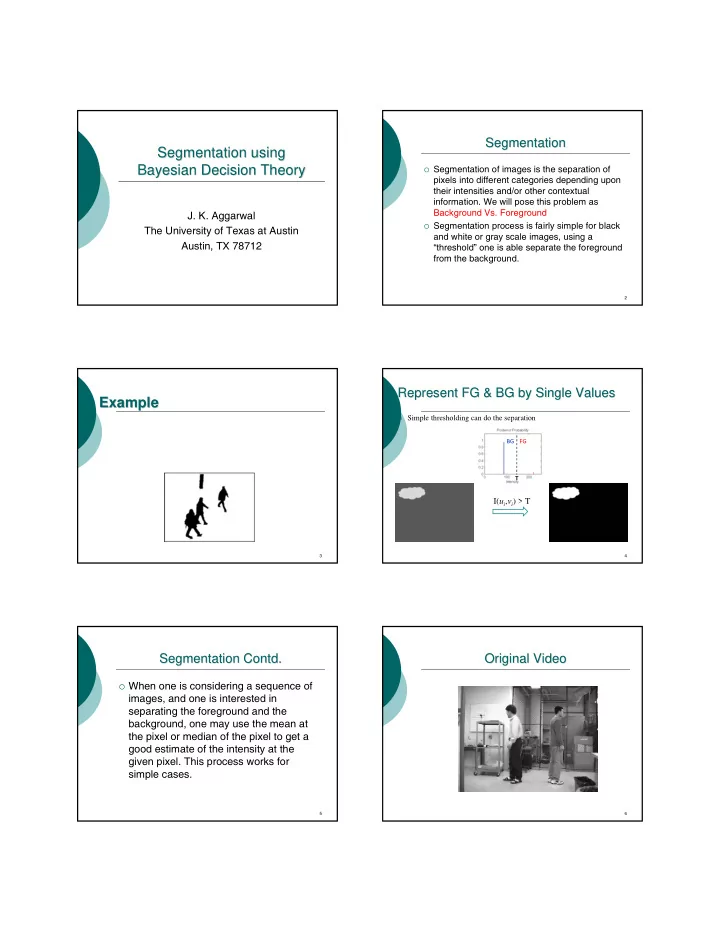
Represent FG & BG by Single Values Represent FG & BG by Single Values

Simple thresholding can do the separation

BG FG

I(ui,vi) > T

T

5

Segmentation Contd. Segmentation Contd.

When one is considering a sequence of

images, and one is interested in separating the foreground and the background, one may use the mean at the pixel or median of the pixel to get a good estimate of the intensity at the given pixel. This process works for simple cases.

6

Original Video Original Video

slide-2
SLIDE 2

7

Mean & Median Images Mean & Median Images

Mean Median

8

Segmentation cont. Segmentation cont.

However, for more robust segmentation,

  • ne may assume that the intensity for the

background and the foreground each is described by a probability density function.

One may use Bayesian Decision Theory

for separating the foreground and background.

9 9

Prior probability Prior probability

In this B vs. F example, let denote the

state of nature

  • = Background
  • = Foreground

Prior (a priori) probabilities

Reflects knowledge of what the next pixel

might be before the pixel appears

  • assuming 2 classes

ω

1

ω

2

ω

1 2

( ), ( ) P P ω ω

1 2

( ) ( ) 1, P P ω ω + =

10 10

Decision Using Only Priors Decision Using Only Priors

Decide on the type of the “pixel” without

being allowed to know the intensity

Decision Rule

Decide if Decide if

This rule decides on the same class for

all pixels!

But under these conditions, no other

classifier can perform better.

1 2

( ) ( ) P P ω ω >

1 2

( ) ( ) P P ω ω <

1

ω

2

ω

11 11

Density Functions Density Functions

Probability density functions, where

denotes the intensity, l and m indicate pixel position. In the most general case

  • ne can assume that each pixel has

different probability density.

1

( | )

l

p x ω

2

( | )

m

p x ω

x

12 12

A Practical Decision Scenario A Practical Decision Scenario

Classify based on some feature, say intensity,

  • f the pixel samples x

We will capture the variability of this feature

using a continuous class-conditional probability distribution

( | ) p x ω

slide-3
SLIDE 3

13 13

Bayes Bayes Rule Rule

Bayes Rule states:

  • is the likelihood of x being in class ωj
  • is the prior probability of class ωj
  • ensures that is a

valid posterior probability function that sums to one.

( | ) ( ) ( | ) ( )

j j j

p x P P x p x ω ω ω =

2 1

( ) ( | ) ( )

j j j

p x p x P ω ω

=

= ∑ ( | )

j

P x ω

( )

|

j

p x ω

( )

j

P ω

14

Bayes Bayes Decision Rule Decision Rule

Bayes decision rule:

Select i.e.

If decision is based entirely

  • n priors

If decision is based entirely on

likelihoods

Bayes rule combines both to achieve

minimum probability of error

1 1 2

if ( | ) ( | ) P x P x ω ω ω >

1 1 2 2

( | ) ( ) ( | ) ( ) p x P p x P ω ω ω ω >

1 2

( | ) ( | ) p x p x ω ω =

1 2

( ) ( ) P P ω ω =

15 15

Levels of Difficulty Levels of Difficulty

One knows probability density functions

and a priori probabilities.

One estimates these probabilities from

  • samples. One may assume normal

distributions or more general forms

You do not have a way of estimating

these probabilities, you pose it as an

  • ptimization problem or a clustering

problem.

16 16

About About Bayes Bayes Rule Rule

Bayes Rule is derived from the joint

distribution

In words, Bayes rule says

( ) ( ) ( ) ( ) ( ) ( ) ( ) ( )

( )

, | | | |

j j j j j j j

p x P x p x p x P p x P P x p x ω ω ω ω ω ω ω = = ∴ =

* likelihood prior posterior evidence =

17 17

Likelihood: p(x|ωj) simply denotes that all other

things being equal, the category ωj for which p(x|ωj) is large is more “likely” to be the category

Evidence: p(x) is simply a scale factor to ensure

that P(ωj|x) is a valid probability function.

Bayes rule converts the prior and the likelihood

to a posterior probability, which can now be used to make decisions

Bayes Bayes Rule (cont.) Rule (cont.)

18 18

Bayes Bayes Rule (cont.) Rule (cont.)

Note that the product of likelihood and prior

probabilities governs the shape of the posterior

Decision Rule:

1 2

( ) 2/3 ( ) 1/3 P P ω ω = =

1 1 2 2

if ( | ) ( | ) else P x P x ω ω ω ω >

slide-4
SLIDE 4

19 19

Error Analysis Error Analysis

  • Average probability of error is

If P(error|x) is as small as possible for

every x, the above integral will be minimized

Hence using Bayes rule

1 2 2 1

( | ) ( | ) ( | ) P x P error x P x ω ω ω ω ⎧ = ⎨ ⎩ if we decide if we decide

( ) ( , ) ( | ) ( ) P error P error x dx P error x p x dx

∞ ∞ −∞ −∞

∫ ∫

= =

[ ]

1 2

( | ) min ( | ), ( | ) P error x P x P x ω ω =

20 20

Variations of the Variations of the Bayes Bayes Rule Rule

Bayes decision rule:

Select i.e.

If decision is based entirely

  • n priors

If decision is based entirely on

likelihoods

Bayes rule combines both to achieve

minimum probability of error

1 1 2

if ( | ) ( | ) P x P x ω ω ω >

1 1 2 2

( | ) ( ) ( | ) ( ) p x P p x P ω ω ω ω >

1 2

( | ) ( | ) p x p x ω ω =

1 2

( ) ( ) P P ω ω =

21

Univariate Univariate Density Density

A Univariate normal density ( )

( )

2

, p x N μ σ ∼

( )

2

1 1 exp 2 2 x p x μ σ πσ ⎡ ⎤ − ⎛ ⎞ = − ⎜ ⎟ ⎢ ⎥ ⎝ ⎠ ⎣ ⎦

22

Univariate Univariate Denisty Denisty (cont.) (cont.)

Expected value

Points tend to cluster around the mean

Variance

Measure of spread of values

Entropy

Measure of uncertainty Normal has max. entropy of all distributions given

mean and variance

[ ] ( )

E x xp x dx μ

∞ −∞

≡ =

( ) ( ) ( )

2 2 2

E x x p x dx σ μ μ

∞ −∞

⎡ ⎤ ≡ − = − ⎣ ⎦

( ) ( ) ( ) ( )

ln H p x p x p x dx

∞ −∞

= −

23

d-dimensional normal density x is a d-component column vector μ is the d-component mean vector Σ is the d-by-d covariance matrix and |Σ|

and Σ-1 are its determinant and inverse, respectively

Multivariate Density Multivariate Density

( ) ( )

, p N ∼ μ Σ x

( ) ( ) ( ) ( )

1 /2 1/ 2

1 1 exp 2 2

t d

p π

⎡ ⎤ = − − − ⎢ ⎥ ⎣ ⎦ Σ μ Σ μ x x x

24

Parameters of the multivariate normal Parameters of the multivariate normal

Mean

  • Computed component-wise; i.e.

Covariance Matrix

  • Always symmetric and positive semidefinite
  • is variance of xi
  • implies that xi and xj are statistically

independent

[ ]

i i

E μ = x ( )( )

ij i i j j

E x x σ μ μ ⎡ ⎤ = − − ⎣ ⎦

ii

σ

ij

σ = ( )( ) ( )( ) ( )

t t

E p d ⎡ ⎤ ≡ − − = − − ⎣ ⎦ ∫ Σ x x x x x x μ μ μ μ

[ ] ( )

E p d μ ≡ = ∫ x x x x

slide-5
SLIDE 5

25

Represent FG & BG by Single Distributions Represent FG & BG by Single Distributions

FG and BG are generated from single 1D normal distributions We are able to estimate the parameters (μi, σi) from the training

sequences

p(I(u,v)|BG) p(I(u,v)|FG) 26

Represent FG & BG by Single Distributions Represent FG & BG by Single Distributions

Assume the prior probabilities are equal

  • belongs to FG if

( ( , ) | ) ( ) ( ( , ) | ) ( ) ( ( , )) ( ( , ))

i j i j i j i j

p I u v FG P FG p I u v BG P BG p I u v p I u v > ( , )

i j

I u v

T BG FG

27

Multivariate Normal Density (cont.) Multivariate Normal Density (cont.)

Loci of points of constant density are

hyper-ellipsoids of the form

  • is the Mahalanobis

distance (squared) from x to μ

Volume of hyperellipsoid

( ) ( )

1 t −

− − μ Σ μ x x

( ) ( )

2 1 t

r

= − − μ Σ μ x x ( )

( ) 1/2 /2 1 /2

/ / 2 ! even 1 2 !/ ! odd 2

d d d d d d

V V r d d V d d d π π

= ⎧ ⎪ = ⎨ − ⎛ ⎞ ⎜ ⎟ ⎪ ⎝ ⎠ ⎩ Σ

28

The Real Situations The Real Situations

In stead of the entire background, the values of a

background pixel over time can be modeled by a single or a mixture of Gaussians

Due to the motion of objects, by pixel foreground

model is usually not available

29

The Real Situations ( cont The Real Situations ( cont ’ ’d) d)

Given a controlled sequence with only background values,

we can train a Gaussian for each pixel location

Without the knowledge of priors and foreground conditional

probability, we can threshold on the Z-value to perform background subtraction

1 1/ 2 3/ 2 2 2

: 1 1 ( ( , ) | ) exp[ ( ( , ) ) ( ( , ) )] 2 (2 ) : ( , ) 1 1 ( ( , ) | ) exp[ ( ) ] 2 2

T i j i j ij i i j ij i j i j ij i j ij ij

Color image p u v BG u v u v Grayscale image I u v p I u v BG π μ σ πσ

= − − − − = − Σ Σ I I μ I μ

( , )

i j ij ij

I u v z μ σ − =

30

The Real Situations ( cont The Real Situations ( cont ’ ’d) d)

In the context of color image, the Mahalanobis distance is

defined as:

The Mahalanobis distance implies the probability of the test

pixel value belonging to the background model

ex: Illustration of BG subtraction in grayscale case

1

( ( , )) ( ( , ) ) ( ( , ) )

T M i i i j ij ij i j ij

D u v u v u v

= − − Σ I I μ I μ T BG FG T BG FG I( , )

i j

u v ?

slide-6
SLIDE 6

31

Results Results

Test image FG image, TM = 4 FG image, TM = 100 FG image, TM = 20

32 32

Example 1 Example 1

Consider the given class conditional probability density functions:

where u(x) is the unit step function:

A priori probabilities:

1 2

1 ( | ) [ ( ) ( 2.5)] 2.5 1 ( | ) [ ( 2) ( 4)] 2 p x u x u x p x u x u x ω ω = − − = − − −

( ) 1, 0, u x x

  • therwise

= ≥ =

1 2

( ) ( ) 1 2 P P ω ω = =

33 33

Example 1 (contd.) Example 1 (contd.)

Plots of various probabilities:

2 4 2 .5 0 .4 0 .5

1

( | ) p x ω

2

( | ) p x ω

p(x)

2 2 .5 4 1 1 2 2

( ) ( | ) ( ) ( | ) ( ) p x p x P p x P ω ω ω ω = +

0 .2 0 0 .4 5 0 .2 5

x → x →

34 34

Example 1 (contd.) Example 1 (contd.)

Observe that there will be error in classification for 2 < x < 2.5, if the true class is , because the Bayes classifier will decide since for this region

( | ) ( ) ( | ) ( )

i i i

p x P P x p x ω ω ω =

Posterior Probabilities:

2 4 2 .5 4 / 9 5 / 9

1

( | ) P x ω

2

( | ) P x ω

1

ω

2

ω

2 1

( | ) ( | ) P x P x ω ω >

1

x →

35 35

Example 1 (contd.) Example 1 (contd.)

  • 1

2.5 1 1 2 2.5 2

( ) (2 2.5, ) ( | ) ( ) 1 0.4 2 0.1 P error P x p x P dx dx ω ω ω ω ∴ = ≤ ≤ = = = × =

∫ ∫

So the probability of error via a Bayes

classifier is 0.1

What is the a priori probability of error?

it is 0.5!

1 2

1 ( ) ( ) , 2 P P ω ω = = Q

36 36

Example 2 Example 2

  • 2

1 2 1

( ) 2 1 1

1 ( | ) 2

x

p x e

μ σ

ω π σ

− −

=

2 2 2 2

( ) 2 2 2

1 ( | ) 2

x

p x e

μ σ

ω π σ

− −

=

1 1 2 2 1 2

1.5 4 1.5 3 1 ( ) ( ) 4 4 where and P P μ σ μ σ ω ω = = = = = =

slide-7
SLIDE 7

37 37

Example 2 (Plots) Example 2 (Plots)

2

( | ) P x ω

x →

1

( | ) p x ω

2

( | ) p x ω

p(x)

1

( | ) P x ω

2.618 1

x → x →

38 38

Example 2 (contd.) Example 2 (contd.)

Decision Boundary

2 2 1 2 2 2 1 2 2 2 1 2 2 2 1 2

1 2 1 1 2 2 ( ) ( ) 2 2 1 2 ( ) ( ) 2 2 2 2

( | ) ( | ) ( | ) ( ) ( | ) ( ) ( ) ( ) 3 1 1 1 4 4 2 2 3 ( 4) log 3 4.5 4.5 2.618

x x x x e

P x P x p x P p x P p x p x e e e e x x x

μ μ σ σ μ μ σ σ

ω ω ω ω ω ω πσ πσ

− − − − − − − −

= = = = − − = − =

39 39

Example 2 (contd.) Example 2 (contd.)

Error Analysis:

( ) ( ) ( ) ( ) ( ) ( ) ( )

2 2 2 1 2 2 2 1

2 1 2.618 2 2 1 1 2.618 ( ) ( ) 2.618 2 2 2.618 2 1 2

2.618, 2.618, | | 1 1 1 3 . . 4 4 2 2 7.4957 10

x x

P error P x P x p x P dx p x P dx e dx e dx

μ μ σ σ

ω ω ω ω ω ω ω ω πσ πσ

∞ −∞ − − ∞ − − −∞ −

= < = + > = = + = + = ×

∫ ∫ ∫ ∫

40 40

Example 3 Example 3

1

( | ) p x ω =

1 1 1 3 4 4 1 5 3 5 4 4 x x x x

  • therwise

− ≤ ≤ − + ≤ ≤ 1 1 4 6 4 1 2 6 8 4 x x x x

  • therwise

− ≤ ≤ − + ≤ ≤

2

( | ) p x ω =

1 2

3 1 ( ) , ( ) 4 4 P P ω ω = =

41 41

Example 3 (Plots) Example 3 (Plots)

2

( | ) P x ω x →

x →

1

( | ) p x ω

2

( | ) p x ω

p(x)

1

( | ) P x ω

4.25

1

1 4 5 8

1/2

1 8 0.375 0.125 0.0625 4

x →

42 42

Example 3 (contd.) Example 3 (contd.)

  • Decision Boundary:

Notice that the optimal boundary lies between

1 2

( | ) ( | ) P x P x ω ω = 4 5 x ≤ ≤

1 1 2 2

( | ) ( ) ( | ) ( ) 1 5 1 1 3 ( ) ( 1) 4 4 4 4 4 1 5 3 3 16 16 16 4 4.25 p x P p x P x x x x x ω ω ω ω = − + = − − + = − =

slide-8
SLIDE 8

43 43

Example 3 (contd.) Example 3 (contd.)

Error Analysis:

( ) ( ) ( ) ( ) ( )

4.25 2 2 1 1 4.25 4.25 5 4 4.25 4.25 5 2 2 4 4.25 2

| | 1 3 1 5 1 1 4 4 4 4 4 3 1 5 4 8 4 8 4 2.3438 10 P error p x P dx p x P dx x dx x dx x x x x ω ω ω ω

∞ −∞ −

= + ⎛ ⎞ ⎛ ⎞ = − + − + ⎜ ⎟ ⎜ ⎟ ⎝ ⎠ ⎝ ⎠ ⎛ ⎞ ⎛ ⎞ = − + − + ⎜ ⎟ ⎜ ⎟ ⎝ ⎠ ⎝ ⎠ = ×

∫ ∫ ∫ ∫