
SLIDE 1
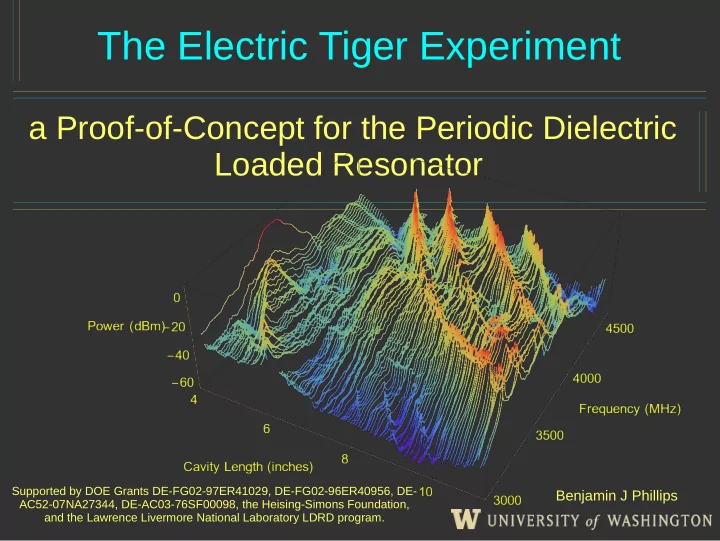
The Electric Tiger Experiment
a Proof-of-Concept for the Periodic Dielectric Loaded Resonator
Supported by DOE Grants DE-FG02-97ER41029, DE-FG02-96ER40956, DE- AC52-07NA27344, DE-AC03-76SF00098, the Heising-Simons Foundation, and the Lawrence Livermore National Laboratory LDRD program.
Benjamin J Phillips