
SLIDE 1
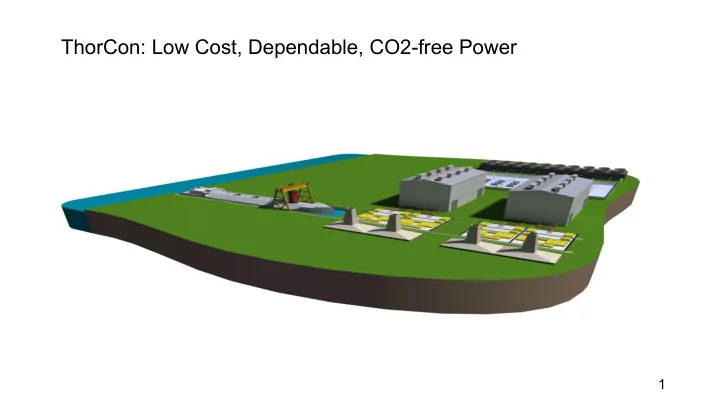
ThorCon: Low Cost, Dependable, CO2-free Power
1
ThorCon: Low Cost, Dependable, CO2-free Power 1 Key Features of - - PowerPoint PPT Presentation
ThorCon: Low Cost, Dependable, CO2-free Power 1 Key Features of ThorCon Technology Safe Low pressure device with passive shutdown - does not depend on operators or electronics Lower cost electricity Provides baseload and load
1
Low pressure device with passive shutdown - does not depend on operators or electronics
Provides baseload and load following electricity at inexpensive rates.
Pragmatic approach that does not depend on new technology
Design can be mass produced at 10-20 GWe per year (or more). 2
One large nuclear plant is around 1GWe Total US usage is 500 Gwe Roughly 1kW/person in Europe & Calif. World population currently 7B people May stabilize at 10-12B => 10-12,000 GWe Oil unlikely to expand 5x. Electricity applications will expand transport Industrial heat Demand could go as high as 70,000 Gwe Nuclear is the only energy source that can do the job with low environmental impact. But to be widely adopted nuclear must be safe and the lowest cost solution.
1970 1980 1990 2000 2010 2020 2030 2040 2050 500 1000 1500 2000 2500 3000 3500 4000 4500 5000 Total Use Total Forecast Fossil Supplied Fossil Forecast
Year Worldwide Electricity Consumption (GWe) Source US Energy Information Administration
yet to be built
years.
problems so that some of the coal power plants are being replaced.
can avoid the problems associated with massive coal burning.
Indi
1950 1960 1970 1980 1990 2000 2010 2020 100 200 300 400 500 600 India Consumption China Electricity Production
3
Ultra large crude carrier cost $89M ThorCon ¼ th the steel and simpler construction
4
Shipyard Productivity
5
Shipyard Quality.
6
power plants per year. Proposed shipyard sufficient to manufacture 10 one GWe power plants per year. 7
8
One large shipyard to factory- build new power plants Barge to NPP site (around 20 barge loads per GWe) NPP sites (1 GWe site shown) 1,000-20,000 GWe total)
9
One large shipyard to factory- build new power plants Barge to NPP site (around 20 barge loads per GWe) NPP sites (1 GWe site shown) 1,000-20,000 GWe total) Canship delivers new cans and takes
transports new fuel and returns spent
to each 1GWe site. Can recycling center cleans and inspects cans, replace graphite, stores offgas and graphite wastes. Similar to a shipyard.
10
One large shipyard to factory- build new power plants Barge to NPP site (around 20 barge loads per GWe) NPP sites (1 GWe site shown) 1,000-20,000 GWe total) Canship delivers new cans and takes
transports new fuel and returns spent
to each 1GWe site. Can recycling center cleans and inspects cans, replace graphite, stores offgas and graphite wastes. Similar to a shipyard. Fuel recycling center. Initial fluorination & vacuum distill to recover most of fuel salt. Store spent fuel for future processing. Future IAEA secure site. Uranium re-enrichment and Pu extraction to recover remaining valuable content.
11
12
13
14 310 m 330 m
reliability and lifetime
module and a smaller turbine/generator.)
15
557 MWt underground power modules.
housed in silos.
primary loop pump, and primary heat exchanger.
year moderator life, Can operates for four years, then cools down for four years, and then is changed out.
16
ThorCon’s Heart: The Can
sec loop time.
chain reaction which heats fuelsalt from 564C to 704C.
Pu-239.
cooling.
17
valve melts and primary loop drains to Fuelsalt Drain Tank (FDT).
reactivity, => no chain reaction, no chance for re-criticality
meltdown and primary containment breach) then the fuel salt drains to FDT.
18
ThorCon is a Four Barrier Design
1. Primary Loop Piping, Pump, Pot, HX 2. Can/Drain Tank, 5 bar over-pressure. 3. Silo Cavity. Inerted. Duplex/triplex barrier. 4. Silo Hall, 1 bar over-pressure. Triplex barrier.
modules.
underground
19
Even if we did, things are going to break and we do not know when. Plan for it.
hard to go in and fix it.
low pressure), and swappable modules.
20
21
Prepare bid packages, negotiate bids, identify any risk areas, draft PSAR Build 250MWe non-fission prototype (year 2), nonfission tests (year 3) Build 500MWe fission plant (year 4)
Tests leading to license (years 5&6) Build reactor yard (year 7) 22
25
26
27
28
29
Year Net Income $M 8 $1,200 9 $4,200 10 $9,000 11 $12,000 12 $12,000 Total $38,400
12 $M Equity $680 Gross Income $66,507 Net Income $39,627 IRR 65%
12