Three-dimensional behaviors of atmospheric CO 2 revealed by the - - PowerPoint PPT Presentation

three dimensional behaviors of atmospheric co 2 revealed
SMART_READER_LITE
LIVE PREVIEW

Three-dimensional behaviors of atmospheric CO 2 revealed by the - - PowerPoint PPT Presentation

Three-dimensional behaviors of atmospheric CO 2 revealed by the CONTRAIL project T. Machida 1 , H. Matsueda 2 , Y. Sawa 2 , Y. Niwa 2 and T. Shirai 1 1. NIES, 2. MRI Old JAL Project (MRI, JAL, JAL F) 1993-2005, Twice/month CO 2 , CH 4 , CO ASE:


slide-1
SLIDE 1

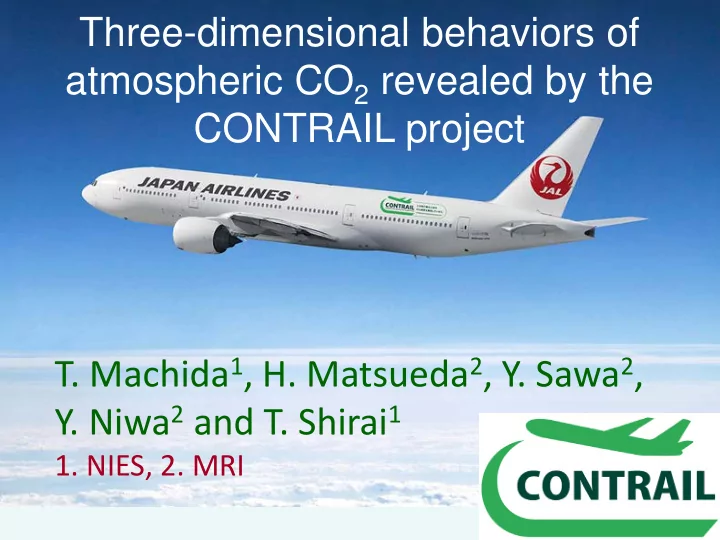
Three-dimensional behaviors of atmospheric CO2 revealed by the CONTRAIL project

  • T. Machida1, H. Matsueda2, Y. Sawa2,
  • Y. Niwa2 and T. Shirai1
  • 1. NIES, 2. MRI
slide-2
SLIDE 2

Old JAL Project (MRI, JAL, JAL F)

ASE: Automatic Air Sampling Equipment

1993-2005, Twice/month CO2, CH4, CO

slide-3
SLIDE 3

CONTRAIL Project since 2005

CME: Continuous CO2 Measuring Equipment new ASE: (CO2, CH4, CO, N2O, SF6, H2, isotopes) CME ASE CME CME CME CME

747-400 (JA8917) Nov/2005- 747-400 (JA8921) Feb/2006- 777-200 (JA705J) Jun/2006- 777-200 (JA703J) Oct/2006- 777-200 (JA707J) Nov/2006-

ASE

Cargo room 747-400

slide-4
SLIDE 4

Six 777-200ER aircraft by JAL

777-200 (JA708J) Jun/2012-

CME CME

777-200 (JA705J) Jun/2006- 777-200 (JA703J) Oct/2006- 777-200 (JA707J) Nov/2006-

CME ASE CME ASE

777-200 (JA709J) Sep/2012-

CME CME

777-200 (JA702J) Mar/2013-

slide-5
SLIDE 5

Time series of CO2 from 30N to 30S

slide-6
SLIDE 6

Observation of CME (-2013/03) flight>7,500 vertical CO2>14,000

slide-7
SLIDE 7

Seasonal changes in CO2 ref=2008 distributions

(8km-tropopause)

Jan. Apr. Jul. Oct.

slide-8
SLIDE 8

Jan.

Longitudinal distributions between 40N and 70N

Low CO2 over the Eurasia in summer

Jan-Apr, Sep-Dec. May-Aug: Large longitudinal differences

Apr. Mar. Feb. Nov. Oct. Sep. Dec. May Jun. Jul. Aug.

(8km-tropopause)

Jul. Aug. (Sawa et al., 2012, JGR)

8

slide-9
SLIDE 9

CO2 cross section by CME data

March

Sawa et al. 2012, JGR.

slide-10
SLIDE 10

using only surface data + CONTRAIL Three-year mean for 2006–2008

CONTRAIL has large impacts on the flux estimate

Niwa et al. 2012, JGR.

slide-11
SLIDE 11

How were inversion fluxes changed by CONTRAIL?

Mean seasonal flux for 2006–2008 inverted by surface data inverted by surface + CONTRAIL data (A) (B) (C) (D) (A) (B) (C) (D)

  • std. for 2006-2008

estimated flux error CASA (prior flux)

consistent with Patra et al. (2011)

  • 0.25

0.11 Pg C/yr-1 0.01

  • 0.14
  • 0.14

0.15 0.08 0.28

Annual net

Niwa et al. 2012, JGR.

slide-12
SLIDE 12

Mean tracer distribution by NICAM model

Niwa et al. 2012, JGR.

slide-13
SLIDE 13

Other two 777-200ER will be modified

CME CME CME

777-200 (JA705J) Jun/2006- 777-200 (JA703J) Oct/2006- 777-200 (JA707J) Nov/2006-

ASE

777-200 (JA708J) Jun/2012-

CME ASE

777-200 (JA702J) Jan/2013-

CME

777-200 (JA710J) 2013-

CME ASE

777-200 (JA711J) 2013-

CME ASE

777-200 (JA709J) Sep/2012-

CME ASE

slide-14
SLIDE 14

CONTRAIL web page

www.cger.nies.go.jp/contrail/

slide-15
SLIDE 15

Thank you.

Please consider to use JAL for your next travel to Japan.

slide-16
SLIDE 16
slide-17
SLIDE 17

CONTRAIL data can be used.

www.cger.nies.go.jp/contrail/protocol.html

slide-18
SLIDE 18

Installation for 747-400

CME ASE Pump

Air-conditioning duct

slide-19
SLIDE 19

CME in Forward-Cargo of 777-200

Air Inlet CME

slide-20
SLIDE 20

ASE in Aft-Cargo of 777-200

slide-21
SLIDE 21

CME data are agree with ASE

378 379 380 381 382 383 384

  • 40
  • 30
  • 20
  • 10

10 20 30 40 CME ASE

CO2[ppm] Latitude [degree N]

Dec 08, 2005