Time Series Time Series Time Series Prof. Paolo Ciaccia Prof. - - PDF document

time series time series time series
SMART_READER_LITE
LIVE PREVIEW

Time Series Time Series Time Series Prof. Paolo Ciaccia Prof. - - PDF document

Time Series Time Series Time Series Prof. Paolo Ciaccia Prof. Paolo Ciaccia http://www- http://www -db. db.deis deis. .unibo unibo. .it it/ /courses courses/SI /SI- -LS/ LS/ 08_TimeSeries.pdf 08_TimeSeries. pdf Sistemi


slide-1
SLIDE 1

Sistemi Informativi LS

Time Series Time Series Time Series

  • Prof. Paolo Ciaccia
  • Prof. Paolo Ciaccia

http://www http://www-

  • db.

db.deis deis. .unibo unibo. .it it/ /courses courses/SI /SI-

  • LS/

LS/ 08_TimeSeries. 08_TimeSeries.pdf pdf

Sistemi Informativi LS 2

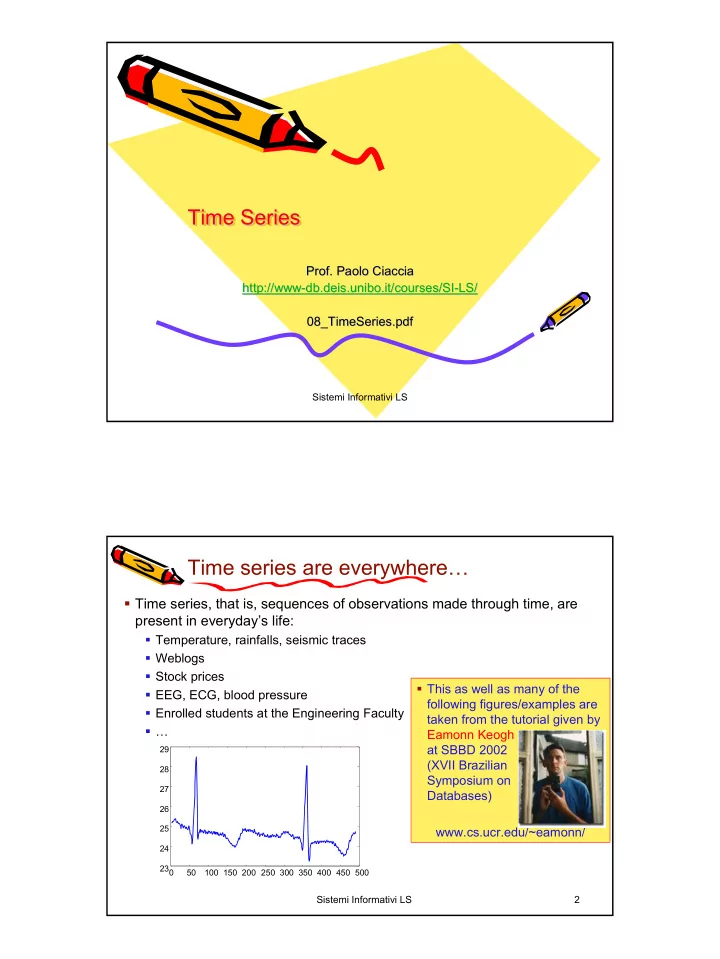
Time series are everywhere…

Time series, that is, sequences of observations made through time, are present in everyday’s life:

Temperature, rainfalls, seismic traces Weblogs Stock prices EEG, ECG, blood pressure Enrolled students at the Engineering Faculty …

50 100 150 200 250 300 350 400 450 500 23 24 25 26 27 28 29

This as well as many of the following figures/examples are taken from the tutorial given by Eamonn Keogh at SBBD 2002 (XVII Brazilian Symposium on Databases) www.cs.ucr.edu/~eamonn/

slide-2
SLIDE 2

Sistemi Informativi LS 3

Why is similarity search in t.s.’s important?

Consider a large time series DB:

1 hour of ECG data: 1 GByte Typical Weblog: 5 GBytes per week Space Shuttle DB: 158 GBytes MACHO Astronomical DB: 2 TBytes, updated with 3 GBytes a day (20 million stars recorded nightly for 4 years) http://wwwmacho.anu.edu.au/

Similarity search can help you in:

Looking for the occurrence of known patterns Discovering unknown patterns Putting “things together” (clustering) Classifiying new data Predicting/extrapolating future behaviors …

Sistemi Informativi LS 4

How to measure similarity

  • Given two time series of equal length D, the commonest way to

measure their (dis-)similarity is based on Euclidean distance

  • However, with Euclidean distance we have to face two basic problems
  • 1. High-dimensionality: (very) large D values
  • 2. Sensitivity to “alignment of values”
  • For problem 1. we need to define

effective lower-bounding techniques that work in a (much) lower dimensional space

  • For problem 2. we will introduce

a new similarity criterion

( ) ( )

∑ − =

= 1

  • D

t 2 t t 2

q s q s, L

q s

slide-3
SLIDE 3

Sistemi Informativi LS 5

Dimensionality reduction: DFT (1)

The first approach to reducing the dimensionality of time series, proposed in [AFS93], was based on Discrete Fourier Transform (DFT) Remind: given a time series s, the Fourier coefficients are complex numbers (amplitude,phase), defined as: From Parseval theorem we know that DFT preserves the energy of the signal: Since DFT is a linear transformation we have: thus, DFT preserves the Euclidean distance And? What can we gain from such transformation??

( )

1 D 0,..., f t/D f 2 j exp s D 1 S

1 D t t f

− = − =

− =

π

( ) ( ) ∑

− = − =

= = =

1 D f 2 f 1 D t 2 t

S S E s s E

( ) ( ) ( )

2 2 1 D f 2 f f 1 D t 2 t t 2 2

Q) (S, L Q S Q S E q s E q s q) (s, L = − = − = − = − =

∑ ∑

− = − =

Sistemi Informativi LS 6

Dimensionality reduction: DFT (2)

The key observation is that, by keeping only a small set of Fourier coefficients, we can obtain a good approximation of the original signal Why: because most of the energy of many real-world signals concentrates in the low frequencies ([AFS+93]): More precisely, the energy spectrum (|Sf|2 vs. f) behaves as O(f-b), b > 0:

b = 2 (random walk or brown noise): used to model the behavior of stock movements and currency exchange rates b > 2 (black noise): suitable to model slowly varying natural phenomena (e.g., water levels of rivers) b = 1 (pink noise): according to Birkhoff’s theory, musical scores follow this energy pattern

Thus, if we only keep the first few coefficients (D’ << D) we can achieve an effective dimensionality reduction

Note: this is the basic idea used by well-known compression standards, such as JPEG (which is based on Discrete Cosine Transform)

For what we have seen, this “projection” technique satisfies the L-B lemma

slide-4
SLIDE 4

Sistemi Informativi LS 7

An example: EEG data

Sampling rate: 128 Hz

Time series (4 secs, 512 points) Energy spectrum

Sistemi Informativi LS 8

Another example

128 points

s’ = approximation of s with 4 Fourier coefficients

20 40 60 80 100 120 140

s s’

1.5698 1.0485 0.7160 0.8406 0.3709 0.4670 0.2667 0.1928

First 4 Fourier coefficients

1.5698 1.0485 0.7160 0.8406 0.3709 0.4670 0.2667 0.1928 0.1635 0.1602 0.0992 0.1282 0.1438 0.1416 0.1400 0.1412 0.1530 0.0795 0.1013 0.1150 0.1801 0.1082 0.0812 0.0347 0.0052 0.0017 0.0002 ...

Fourier coefficients

0.4995 0.5264 0.5523 0.5761 0.5973 0.6153 0.6301 0.6420 0.6515 0.6596 0.6672 0.6751 0.6843 0.6954 0.7086 0.7240 0.7412 0.7595 0.7780 0.7956 0.8115 0.8247 0.8345 0.8407 0.8431 0.8423 0.8387 …

data values

slide-5
SLIDE 5

Sistemi Informativi LS 9

Comments on DFT

☺ Can be computed in O(DlogD) time using FFT (provided D is a power of 2) Difficult to use if one wants to deal with sequences of different length Not really amenable to deal with “signals with spots” (time-varying energy) An alternative to DFT is to use wavelets, which takes a different perspective:

A signal can be represented as a sum of contributions, each at a different resolution level Discrete Wavelet Transform (DWT) can be computed in O(D) time

Experimental results however show that the superiority of DWT w.r.t. DFT is dependent on the specific dataset

200 400 600

Good for wavelets bad for Fourier Good for Fourier bad for wavelets

200 400 600

Sistemi Informativi LS 10

Dimensionality reduction: PAA

PAA (Piecewise Aggregate Approximation) [KCP+00,YF00] is a very simple, intuitive and fast (O(D)) method to approximate time series

Its performance is comparable to that of DFT and DWT

We take a window of size W and segment our time series into D’ = D/W “pieces” (sub-sequences), each of size W For each piece, we compute the average of values, i.e. Our approximation is therefore s’ = (s’1,…,s’D’) We have √W× L2(s’,q’) ≤ L2(s,q) (arguments generalize those used for the “global average” example)

The same can be generalized to work with arbitrary Lp-norms [YF00]

( )

W s s

1 W i W 1 i t t ' i

− × × − =

=

20 40 60 80 100 120 140

s s' W

slide-6
SLIDE 6

Sistemi Informativi LS 11

The “alignment” problem

Euclidean distance, as well as other Lp-norms, are not robust w.r.t., even small, contractions/expansions of the signal along the time axis

E.g., speech signals

Intuitively, we would need a distance measure that is able to “match” a point of time series s even with “surrounding” points of time series q

Alternatively, we may view the time axis as a “stretchable” one

A distance like this exists, and is called “Dynamic Time Warping” (DTW)!

Fixed Time Axis Sequences are aligned “one to one” “Warped” Time Axis Non-linear alignments are possible

Sistemi Informativi LS 12

How to compute the DTW (1)

Assume that the two time series s and q have the same length D

Note that with DTW this is not necessary anymore!

Construct a D×D matrix d, whose element di,j is the distance between si and qj

We take di,j = (si - qj)2, but other possibilities exist (e.g., |si – qj|)

The “rules of the game”:

Start from (0,0) and end in (D-1,D-1) Take one step at a time At each step, move only by increasing i, j, or both

I.e., never go back!

“Jumps” are not allowed! Sum all distances you have found in the “warping path”

5 4 3 2 1 4 7 3 3 1 4 2 5 3 2 2 q 1 s

D=6

4 3 1 2 3 2 d 9 4 1 1 9 4 1 4 1 1 1 1 1 2 4 16 9 4 9 5 1 9 4 1 4 4 16 4 36 1 25 16 1 25 3 7

s q L2(s,q) = √29

slide-7
SLIDE 7

Sistemi Informativi LS 13

How to compute the DTW (2)

The figure shows a possible warping path w, whose “cost” is 21

The “Euclidean path” moves only along the main diagonal, and costs 29

The DTW is the minimum cost among all the warping paths But the number of path is exponential in D Ok, but we can use dynamic programming, with complexity O(D2) ☺

4 3 1 2 3 2 9 4 1 1 9 4 1 4 1 1 1 1 1 2 4 16 9 4 9 5 1 9 4 1 4 4 16 4 36 1 25 16 1 25 3 7

s q warping path w

Sistemi Informativi LS 14

How to compute the DTW (3)

From the d matrix, incrementally build a new matrix WP, whose elements wpi,j are recursively defined as:

4 3 1 2 3 2 d 9 4 1 1 9 4 1 4 1 1 1 1 1 2 4 16 9 4 9 5 1 9 4 1 4 4 16 4 36 1 25 16 1 25 3 7

s q

4 3 1 2 3 2 WP 19 8 5 5 6 15 10 6 6 5 1 1 4 3 2 2 1 2 7 18 11 5 10 5 8 18 9 6 14 4 8 24 11 43 7 31 6 22 15 40 3 7

} wp , wp , min{wp d wp

1 j- 1,

  • i

1 j- i, j 1,

  • i

j i, j i,

+ =

s q

Then set dDTW(s,q) = √wpD-1,D-1

slide-8
SLIDE 8

Sistemi Informativi LS 15

A real-world graphical example

Power-Demand time teries Each sequence corresponds to a week’s demand for power in a Dutch research facility in 1997 Monday was a holiday Wednesday was a holiday

Sistemi Informativi LS 16

Fast searching with DTW

  • We have now 2 problems to face, if we want to use DTW for searching:
  • 1. Computing the DTW is very time-consuming
  • 2. How to index it?
  • Both problems can be solved:
  • 1. Use a lower-resolution approximation of the time series
  • However the method can introduce false dismissals

1.3 sec 22.7 sec

slide-9
SLIDE 9

Sistemi Informativi LS 17

Indexing the DTW (sketch) (1)

  • An effective indexing technique for DTW has been proposed in [Keo02]
  • The method applies only if we have some “global constraint” on the

allowed warping paths q s

The Sakoe-Chiba band

  • f width h=4

s q

4 3 1 2 3 2 WP 7 8 17 6 5 1 1 3 2 2 1 2 7 18 11 5 10 5 8 18 9 6 4 8 24 11 43 7 3 7

Our example with h=2

Sistemi Informativi LS 18

Indexing the DTW (sketch) (2)

  • The idea is to create an “envelope”, whose size depends on h,
  • f the query q…
  • …then each time series s in the DB is approximated using PAA…
  • …a distance function between an approximation of the query envelope

(which depends on the window size W of PAA) and the PAA representation s’ of s is then defined…

  • …it is proved that this distance function lower bounds dDTW…
  • …and that PAA approximations can be indexed by an R-tree

L U q Ui = max{qi-h,…, qi+h} Li = min{qi-h,…, qsi+h}

slide-10
SLIDE 10

Sistemi Informativi LS 19

Some experimental results (from [Keo02])

Two datasets (left: synthetic; right: a mix of real data)

0.2 0.4 0.6 0.8 1 210 212 214 216 218 220

Normalized CPU Cost

210 212 214 216 218 220

Random Walk II Mixed Bag

  • Seq. scan

LB_Keogh

  • Seq. scan

LB_Keogh DB size DB size

Sistemi Informativi LS 20

Final considerations

We have just seen some basic techniques to deal with (large) time series databases Other relevant problems exist and have attracted interest, among which:

Searching for similar sub-sequences Searching for multi-dimensional time series (i.e., trajectories)