SLIDE 1
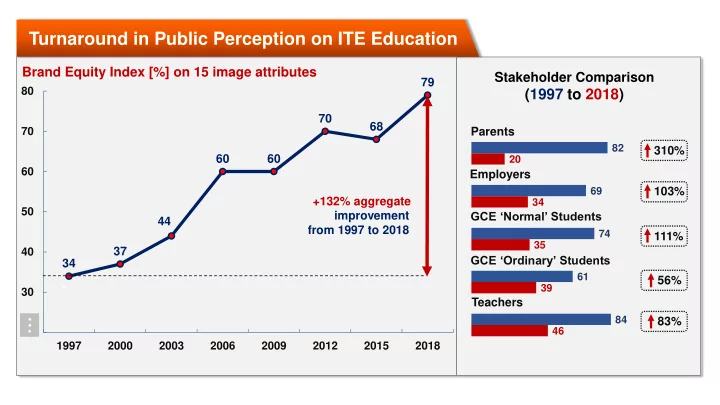
34 37 44 60 60 70 68 79
20 30 40 50 60 70 80 1997 2000 2003 2006 2009 2012 2015 2018
Turnaround in Public Perception on ITE Education
46 39 35 34 20 84 61 74 69 82
Parents Employers GCE ‘Normal’ Students GCE ‘Ordinary’ Students Teachers 310% 103% 111% 56% 83%
Stakeholder Comparison
(1997 to 2018)
+132% aggregate improvement from 1997 to 2018
Brand Equity Index [%] on 15 image attributes
SLIDE 2
Employers’ Surveys on ITE Graduates
89 88 84 86 90 97 93 89 88 95 97 92 92 94 97
78 80 82 84 86 88 90 92 94 96 98 100
Technical Skills & Competencies Generic Skills & Competencies (GSC) Work Attitude Professional Etiquette & Ethics Overall Work Performance
2013 2016 2019
[%]
SLIDE 3
Virtual Meetings Use of Analytics Online Learning
Impact of COVID-19 on Education and Training
Analytics of Online Attendance, Participation and Engagement 100% Home-Based Learning Increased Proportion of Online Learning Video Conferencing and Virtual Meetings/Classrooms Increase in Virtual Meetings (less travel within and out of country) Young Students and Adult Workers Together in Same Online Learning Module Blurring lines of Full-Time and Part-Time Students/Learning Teachers’ Pastoral, Pedagogical and Digital Skills are Paramount Growing Teachers’ Repertoire of Competencies and Strategies
`
Post-COVID-19
Analytics + AI to Customise Learning
Current
Learning Community Digital Competencies
SLIDE 4
*
Value this set of workers – better pay, recognition of skills Recalibrate & building local capabilities vs reducing business cost Re-evaluate vulnerabilities and establish overseas nodes – Singaporeans’ willingness to work overseas
Emerging and Disappearing Jobs
Essential Services Local Capabilities & Workforce Global Supply Chain