
SLIDE 1
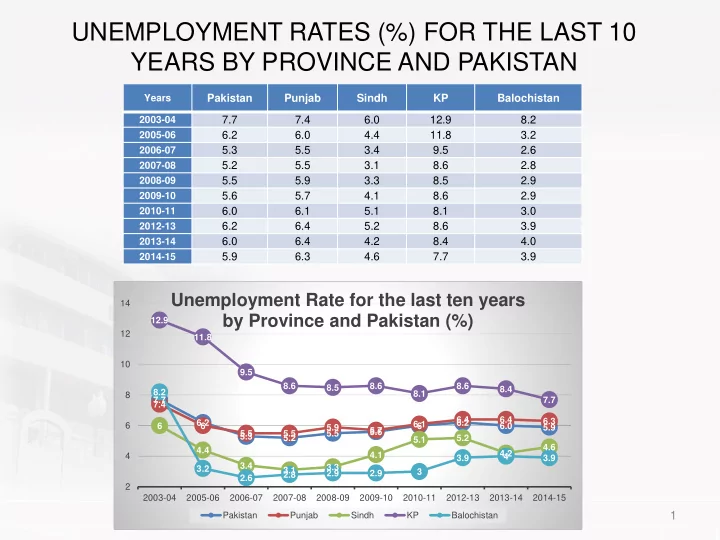
UNEMPLOYMENT RATES (%) FOR THE LAST 10 YEARS BY PROVINCE AND PAKISTAN
Years
Pakistan Punjab Sindh KP Balochistan
2003-04
7.7 7.4 6.0 12.9 8.2
2005-06
6.2 6.0 4.4 11.8 3.2
2006-07
5.3 5.5 3.4 9.5 2.6
2007-08
5.2 5.5 3.1 8.6 2.8
2008-09
5.5 5.9 3.3 8.5 2.9
2009-10
5.6 5.7 4.1 8.6 2.9
2010-11
6.0 6.1 5.1 8.1 3.0
2012-13
6.2 6.4 5.2 8.6 3.9
2013-14
6.0 6.4 4.2 8.4 4.0
2014-15
5.9 6.3 4.6 7.7 3.9
1
7.7 6.2 5.3 5.2 5.5 5.6 6 6.2 6.0 5.9 7.4 6 5.5 5.5 5.9 5.7 6.1 6.4 6.4 6.3 6 4.4 3.4 3.1 3.3 4.1 5.1 5.2 4.2 4.6 12.9 11.8 9.5 8.6 8.5 8.6 8.1 8.6 8.4 7.7 8.2 3.2 2.6 2.8 2.9 2.9 3 3.9 4 3.9 2 4 6 8 10 12 14 2003-04 2005-06 2006-07 2007-08 2008-09 2009-10 2010-11 2012-13 2013-14 2014-15
Unemployment Rate for the last ten years by Province and Pakistan (%)
Pakistan Punjab Sindh KP Balochistan