
Statistics for Managers V4 11 Aug 2015 www.StatLit.org/pdf/2015-Schield-ASA-6up.pdf Page 1
2015 ASAV4 1
by Milo Schield, Augsburg College Member: International Statistical Institute US Rep: International Statistical Literacy Project Director, W. M. Keck Statistical Literacy Project August 11, 2015
Paper: www.StatLit.org/pdf/2015-Schield-ASA.pdf Slides: www.StatLit.org/pdf/2015-Schield-ASA-6up.pdf
Statistical Inference for Managers
V4
2015 ASA2
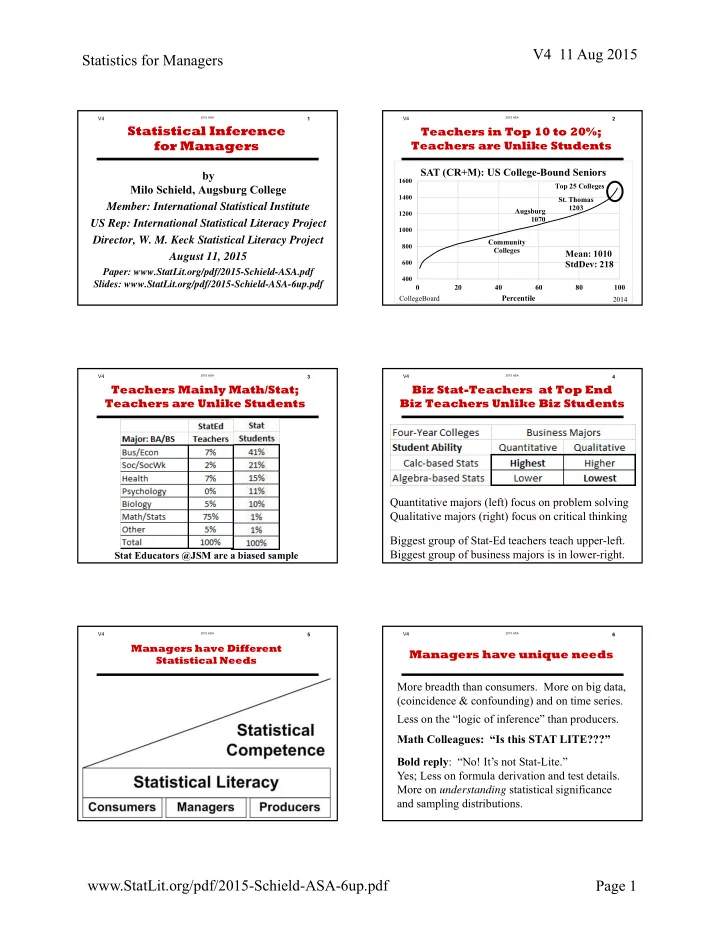
Teachers in Top 10 to 20%; Teachers are Unlike Students
.
400 600 800 1000 1200 1400 1600
20 40 60 80 100
Percentile
SAT (CR+M): US College-Bound Seniors
CollegeBoard
Mean: 1010 StdDev: 218
2014 Top 25 Colleges Community Colleges
- St. Thomas
1203 Augsburg 1070
V4
2015 ASA3
Teachers Mainly Math/Stat; Teachers are Unlike Students
Stat Educators @JSM are a biased sample
V4
2015 ASA4
Biz Stat-Teachers at Top End Biz Teachers Unlike Biz Students Quantitative majors (left) focus on problem solving Qualitative majors (right) focus on critical thinking Biggest group of Stat-Ed teachers teach upper-left. Biggest group of business majors is in lower-right.
V4
2015 ASA5
Managers have Different Statistical Needs
.
V4
2015 ASA6
Managers have unique needs More breadth than consumers. More on big data, (coincidence & confounding) and on time series. Less on the “logic of inference” than producers. Bold reply: “No! It’s not Stat-Lite.” Yes; Less on formula derivation and test details. More on understanding statistical significance and sampling distributions. Math Colleagues: “Is this STAT LITE???”