
SLIDE 1
لولؤا لحنلا ةيبرتل ةيبرعلا ةيعمجلا رمتؤم 5-6 رياربف2018م ضراعملل ينطولا يبظوبأ زكرم-ةدحتملا ةيبرعلا تاراملئا هلود Barcoding of the honeybee Apis mellifera of Saudi Arabia Yehya Zaki Alattal Associate Professor King Saud University 5-6/2/2018
1
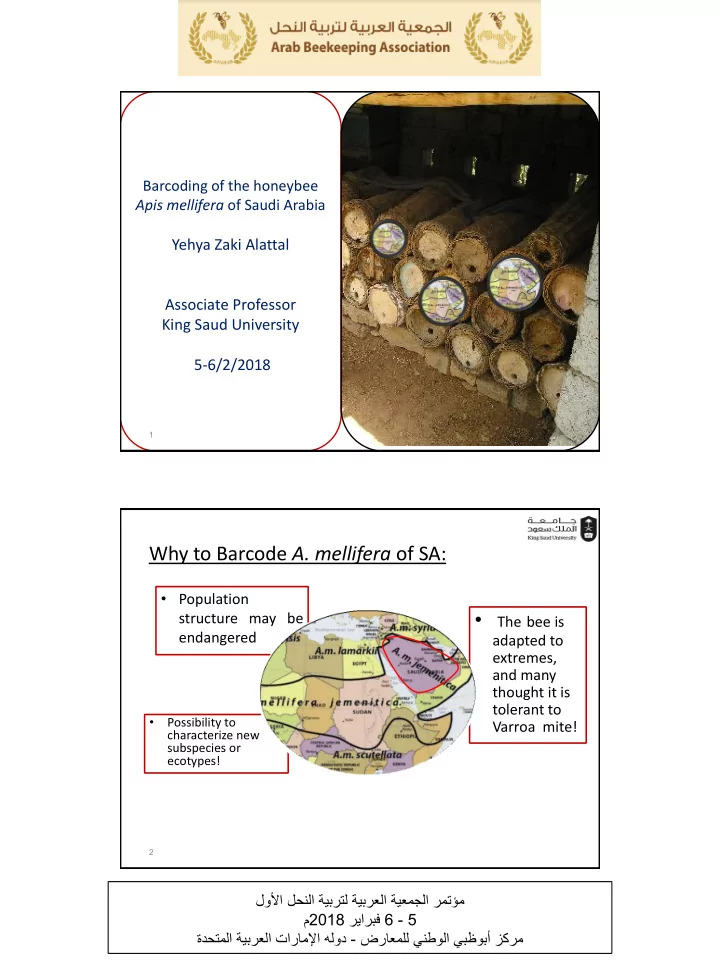
Why to Barcode A. mellifera of SA:
- The bee is
adapted to extremes, and many thought it is tolerant to Varroa mite!
- Population
structure may be endangered
- Possibility to
characterize new subspecies or ecotypes!
2