Winmeen VAO Mission 100 2018 Conversion of Information to data - - - PDF document

winmeen vao mission 100 2018
SMART_READER_LITE
LIVE PREVIEW

Winmeen VAO Mission 100 2018 Conversion of Information to data - - - PDF document

Winmeen VAO Mission 100 2018 Conversion of Information to data - Collection, compilation and presentation of data tables, graphs, diagrams Analytical interpretation of data 1. Count the number of rectangles in the following figure (A) 8 (B)


slide-1
SLIDE 1

Winmeen VAO Mission 100 2018 1 www.winmeen.com | Paid Copy – Don’t Share With Anyone

Conversion of Information to data - Collection, compilation and presentation

  • f data tables, graphs, diagrams – Analytical interpretation of data
  • 1. Count the number of rectangles in the following figure

(A) 8 (B) 17 (C) 18 (D) 20 Answer: (C) 18.

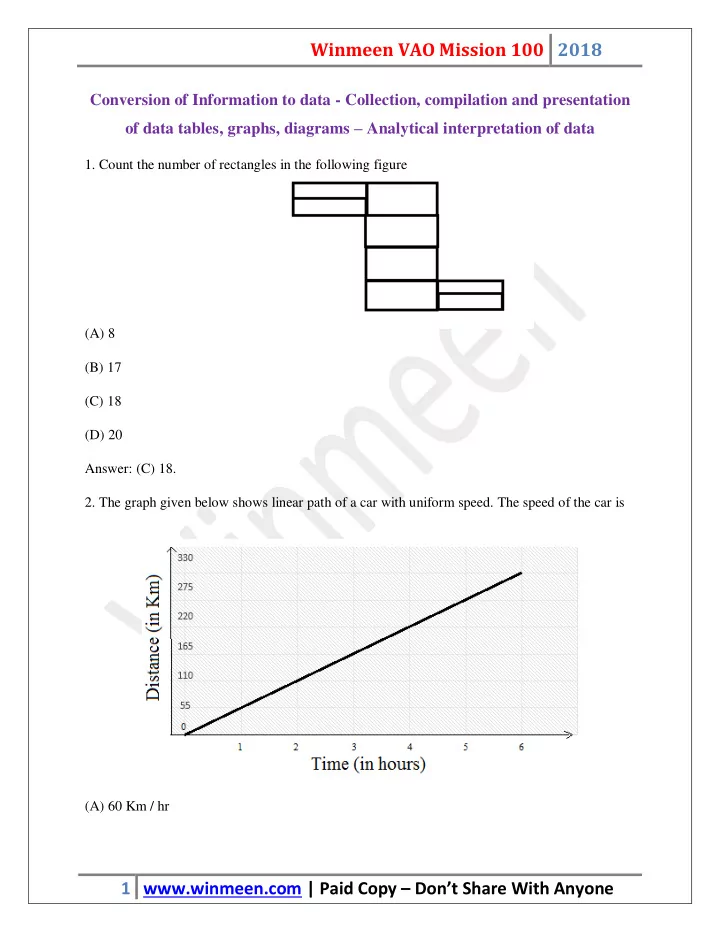
  • 2. The graph given below shows linear path of a car with uniform speed. The speed of the car is

(A) 60 Km / hr

slide-2
SLIDE 2

Winmeen VAO Mission 100 2018 2 www.winmeen.com | Paid Copy – Don’t Share With Anyone

(B) 50 Km / hr (C) 55 Km / hr (D) 45 Km / hr Answer: (C) 55 Km / hr

  • 3. In the graph of y = - 3x2, what is the value of ordinate when the abscissa is -2?

(A) 12 (B) -12 (C) (D) Answer: (B) -12.

  • 4. How many hours does a school student spend at school and doing homework from the pie

diagram given below: Time spent by a school student per day (24 hrs). (A) 6 hrs (B) 3 hrs (C) 9 hrs (D) 4 hrs

slide-3
SLIDE 3

Winmeen VAO Mission 100 2018 3 www.winmeen.com | Paid Copy – Don’t Share With Anyone

Answer: (C) 9 hrs.

  • 5. Price movements in different months

If X represents the price of 10gm of gold in May and Y represents the price of 1000 grams of silver in June, then the relationship between the two prices can best be expressed by the equation (A) Y = 2x + 630 (B) x = 2y + 630 (C) y/x = 2.23 (D) 3x/y = 2.39 Answer: (A) Y = 2x + 630

  • 6. There are 600 creatures in a zoo as per list below

Creatures Wild Animal Birds Other Land Animals Water Animals Reptiles Number of Creatures 200 100 160 65 75 To represent this by a pie chart, the central angle of the sector of the circle representing birds is (A) 360° (B) 120° (C) 60°

slide-4
SLIDE 4

Winmeen VAO Mission 100 2018 4 www.winmeen.com | Paid Copy – Don’t Share With Anyone

(D) 96° Answer: (C) 60°. Ans: c

  • 7. How much money does a family earning Rs. 4,800 per month spend on House rent and

education and on food alone respectively from the pie diagram below (A) Rs.1920 & Rs.1280 (B) Rs.1920 (C) Rs.1280 & Rs.1920 (D) Rs.3200 Answer: (C) Rs.1280 & Rs.1920

  • 8. In which year the production of scooters of all types taken together exceeds the average annual

production from the table given below: Year / Type 2007 2008 2009 2010 TOTAL A 16 20 8 21 65 B 14 10 16 12 52 C 16 17 21 13 67

slide-5
SLIDE 5

Winmeen VAO Mission 100 2018 5 www.winmeen.com | Paid Copy – Don’t Share With Anyone

D 10 6 4 20 40 E 19 18 25 14 76 75 71 74 80 300 Production of scooters by a company (A) 2010 (B) 2007 (C) 2009 (D) 2008 Answer: (A) 2010.

  • 9. Percentage of girls in each of the colleges in shown in the figure. Total number of girls is
  • 1800. What is the number of girls in college D?

(A) 188 (B) 198 (C) 176 (D) 164

slide-6
SLIDE 6

Winmeen VAO Mission 100 2018 6 www.winmeen.com | Paid Copy – Don’t Share With Anyone

Answer: (B) 198

  • 10. The sum of numbers common to two diagrams is

(A) 8 (B) 9 (C) 10 (D) 11 Answer: (D) 11.

  • 11. From the cyclic quadrilateral find x

(A) 90 degree (B) 60 degree (C) 30 degree

slide-7
SLIDE 7

Winmeen VAO Mission 100 2018 7 www.winmeen.com | Paid Copy – Don’t Share With Anyone

(D) 20 degree Answer: (D) 20 degree.

  • 12. The number of teachers less than 50 years of age, from the histogram given below is

(A) 18 (B) 28 (C) 29 (D) 30 Answer: (D) 30

  • 13. From the graph given below, find out during how many years the growth rate was below the

average growth rate over the given years

slide-8
SLIDE 8

Winmeen VAO Mission 100 2018 8 www.winmeen.com | Paid Copy – Don’t Share With Anyone

(A) 3 (B) 4 (C) 5 (D) 2 Answer: (B) 4

  • 14. The ratio of number of students taking cricket to the number of students taking tennis in class

C from the following diagram is

slide-9
SLIDE 9

Winmeen VAO Mission 100 2018 9 www.winmeen.com | Paid Copy – Don’t Share With Anyone

(A) 9:11 (B) 11:9 (C) 9:2 (D) 2:9 Answer: (A) 9:11

  • 15. The number of triangles in the below figure is

(A) 20

10 20 30 40 50 60 70 80 A B C D

Classes

Tennis Chess Cricket

N

  • .

St u d e n ts (i n H u n

slide-10
SLIDE 10

Winmeen VAO Mission 100 2018 10 www.winmeen.com | Paid Copy – Don’t Share With Anyone

(B) 24 (C) 28 (D) 32 Answer: (C) 28

  • 16. How many squares are there in the following figure

(A) 16 (B) 17 (C) 25 (D) 30 Answer: (D) 30

  • 17. How many rectangles are there in the figure below:

(A) 6

slide-11
SLIDE 11

Winmeen VAO Mission 100 2018 11 www.winmeen.com | Paid Copy – Don’t Share With Anyone

(B) 7 (C) 8 (D) 9 Answer: (D) 9

  • 18. The circle graph given here shows the spending of a country on various sports during a

particular year. Study the graph and answer the question: If the total (A) Rs.8,00,000 (B) Rs.80,00,000 (C) Rs.120,00,000 (D) Rs.160,00,000 Answer: (B) Rs.80,00,000

  • 19. The distance travelled by a car in 4.5 hours from the graph below is
slide-12
SLIDE 12

Winmeen VAO Mission 100 2018 12 www.winmeen.com | Paid Copy – Don’t Share With Anyone

(A) 180 Km (B)140 Km (C) 200 Km (D) 220 Km Answer: (A) 180 Km

  • 20. How many triangles are there in the figure given below

(A) 16 (B) 18

slide-13
SLIDE 13

Winmeen VAO Mission 100 2018 13 www.winmeen.com | Paid Copy – Don’t Share With Anyone

(C) 19 (D) 20 Answer: (C) 19.

  • 21. The circle graph given here shows the spendings of a country on various sports during a

particular year. Study the graph and answer the question. (A) 22

%

(B) 27 % (C) 33

%

(D) 37

%

Answer: (C) 33

%

  • 22. How many triangles are there in the given figure
slide-14
SLIDE 14

Winmeen VAO Mission 100 2018 14 www.winmeen.com | Paid Copy – Don’t Share With Anyone

(A) 28 (B) 26 (C) 24 (D) 22 Answer: (A) 28.

  • 23. How many squares are there in the given figure

(A) 9 (B) 14 (C) 16 (D) 18 Answer: (B) 14.

  • 24. How many straight lines are there in the figure below.
slide-15
SLIDE 15

Winmeen VAO Mission 100 2018 15 www.winmeen.com | Paid Copy – Don’t Share With Anyone

(A) 10 (B) 12 (C) 16 (D) 8 Answer: (B) 12.

  • 25. How many squares are there in the figure given below

(A) 4 (B) 5 (C) 6 (D) 7 Answer: (D) 7.

  • 26. How many triangles are there in the following figure?
slide-16
SLIDE 16

Winmeen VAO Mission 100 2018 16 www.winmeen.com | Paid Copy – Don’t Share With Anyone

(A) 10 (B) 14 (C) 20 (D) 22 Answer: (C) 20.

  • 27. How many squares are there in the figure below

(A) 16 (B) 15 (C) 14 (D) 12 Answer: (B) 15.

slide-17
SLIDE 17

Winmeen VAO Mission 100 2018 17 www.winmeen.com | Paid Copy – Don’t Share With Anyone

  • 28. Count the number of triangles in the figure

(A) 17 (B) 13 (C) 15 (D) 16 Answer: (D) 16.

  • 29. From the following graph which of the following years was the ratio of income to

expenditure the minimum

slide-18
SLIDE 18

Winmeen VAO Mission 100 2018 18 www.winmeen.com | Paid Copy – Don’t Share With Anyone

(A) 1996 (B) 1995 (C) 1998 (D) 2000 Answer: (B) 1995.

  • 30. Percent profit earned by a company over the years is given in the following graph using the

formulae % profit = ×100

If the income in 1998 was Rs.264 crores, what was the expenditure in 1998? (A) 160 crores (B) 145 crores (C) 104 crores (D) 185 crores Answer: (A) 160 Crores.

  • 31. The circle graph given here shows the spendings of a country on various sports during a

particular year. Study the graph and answer the question.

slide-19
SLIDE 19

Winmeen VAO Mission 100 2018 19 www.winmeen.com | Paid Copy – Don’t Share With Anyone

What percent of the total spendings is spent on Tennis? (A) 12.5% (B) 22.5% (C) 25% (D) 45% Answer: (A) 12.5%

  • 32. Monthly expenditure of a person whose monthly salary is 9000 is as shown in the diagram.

The percentage of money spent for medical expenses is (A) 10%

slide-20
SLIDE 20

Winmeen VAO Mission 100 2018 20 www.winmeen.com | Paid Copy – Don’t Share With Anyone

(B) 20% (C) 30% (D) 40% Answer: (B) 20%.

  • 33. A man earns Rs.28000 as monthly salary. His expenditure and savings are given in the
  • diagram. How much he spent every month other than food as expenditure.

(A) 11200 (B) 11300 (C) 15400 (D) 12500 Answer: (A) 11200

  • 34. From the pie diagram given below find the central angle E degree
slide-21
SLIDE 21

Winmeen VAO Mission 100 2018 21 www.winmeen.com | Paid Copy – Don’t Share With Anyone

(A) 25 degrees (B) 45 degrees (C) 50 degrees (D) 60 degrees Answer: (B) 45 Degrees.

  • 35. The sum of numbers common to two diagrams is

(A) 118 (B) 110 (C) 108 (D) 130 Answer: (A) 118.

slide-22
SLIDE 22

Winmeen VAO Mission 100 2018 22 www.winmeen.com | Paid Copy – Don’t Share With Anyone

  • 36. The ratio of the number of students in the class VII to class IX is

(A) 2:3 (B) 1:1 (C) 3:4 (D) 1:2 Answer: (C) 3:4.