
SLIDE 1
WOMEN, INEQUALITY & THE FUTURE OF CALIFORNIA MANUEL PASTOR - - PDF document
10/20/2014 WOMEN, INEQUALITY & THE FUTURE OF CALIFORNIA MANUEL PASTOR @Prof_MPastor 10.22.14 1 10/20/2014 Changing Demographics California, 1980 2040 100% 3% 3% 3% 3% 3% 5% 9% 11% 90% 13% Other 14% 14% 14% 19% 80%
67% 57% 47% 40% 37% 34% 32% 8% 7% 6% 6% 6% 5% 5% 19% 26% 32% 38% 41% 43% 45% 5% 9% 11% 13% 14% 14% 14% 3% 3% 3% 3% 3% 0% 10% 20% 30% 40% 50% 60% 70% 80% 90% 100% 1980 1990 2000 2010 2020 2030 2040 Changing Demographics California, 1980‐2040 Other Native American Asian/Pacific Islander Latino Black White
Latina Women, $9 White Men, $40
$5 $10 $15 $20 $25 $30 $35 $40
Less than a HS Diploma HS Diploma, no College More than HS Diploma but less than BA Degree BA Degree
Median Hourly Wage by Education Level California, 2006-2010
White Women Black Women Latina Women Asian/Pacific Islander Women White Men Black Men Latino Men Asian/Pacific Islander Men Full‐time Wage & Salary Workers Only (Ages 25‐64)
Total Percent below poverty level Total Percent below poverty level Total Percent below poverty level 8,495,322 10.2% 6,166,334 6.1% 1,615,112 24.6% 4,629,191 15.1% 3,169,964 8.7% 1,058,722 32.8% 8,301,406 10.2% 6,037,918 6.1% 1,566,914 24.6% 5,447,834 8.2% 4,141,406 5.0% 899,165 21.9% 503,157 16.7% 229,409 5.4% 218,457 28.4% 66,475 16.7% 41,170 9.6% 17,534 32.2% 1,122,706 7.8% 885,041 5.9% 158,382 17.0% 30,307 10.2% 21,180 6.7% 6,037 20.5% 1,130,927 18.7% 719,712 12.9% 267,339 34.8% 193,916 10.9% 128,416 5.6% 48,198 23.8% 2,714,013 17.8% 1,770,229 12.4% 629,741 33.5% 3,967,947 4.9% 3,155,984 2.7% 564,229 15.4% 6,433,849 7.5% 4,683,715 4.5% 1,157,167 18.1% 4,363,296 3.7% 3,247,226 2.7% 702,875 7.5% 1,529,745 24.5% 989,949 18.2% 363,537 42.7% 1,634,668 13.0% 1,084,010 7.7% 372,323 27.6% 2,625,401 7.8% 1,835,196 3.7% 574,311 20.0% 2,705,508 2.8% 2,257,179 2.0% 304,941 8.1% 3,866,131 4.4% 2,996,370 3.3% 556,390 9.0% 3,589,930 11.8% 2,430,181 6.1% 834,838 27.1% 942,181 24.7% 675,348 16.0% 198,676 52.2% 97,080 42.4% 64,435 31.7% 25,208 68.4% Ca California All families Married-couple families Female householder, no husband RA RACE A AND H HISPAN ANIC IC OR OR LATINO OR ORIG IGIN IN Families with a householder who is-- Fa Families es With related children under 18 years American Indian and Alaska Native Asian Native Hawaiian and Other Pacific Islander One race White Black or African American Hispanic or Latino origin (of any race) White alone, not Hispanic or Latino Some other race Two or more races Less than high school graduate High school graduate (includes equivalency) Some college, associate's degree EDU EDUCATIO IONAL A L ATTA TTAINMENT O OF HO HOUSEHOLDE DER Householder worked Householder worked full-time, year-round 5 or more children No child 1 or 2 children 3 or 4 children Bachelor's degree or higher NUMBER OF R RELA LATE TED C D CHILDR DREN U UNDE DER 18 YEARS
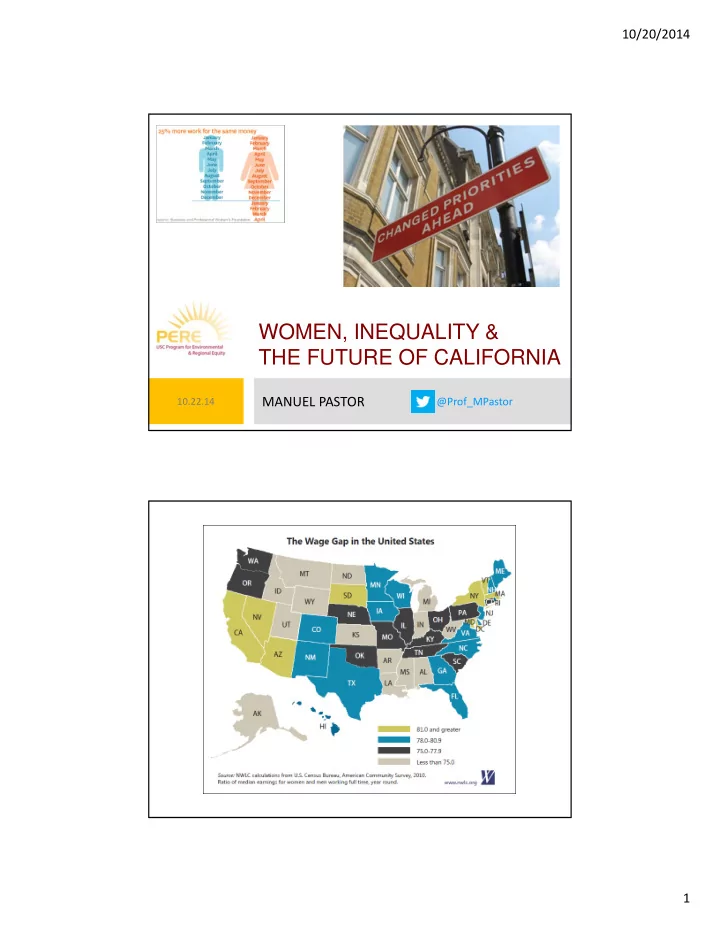
So urc e : U .S. Ce nsus B ure au. No te s: Are as in white are missing data.
61% 51% 43% 43% 42% 40% 39% 36% 36% 34% 34% 33% 29% 28% 26% 25% 23% 22% 20% 20% 20% 15% 0% 10% 20% 30% 40% 50% 60% 70% Apparel Manufacturing Leather and Allied Product Manufacturing Non manufacturing Printing and Related Support Activities Textile Product Mills Miscellaneous Manufacturing Food Manufacturing Textile Mills Chemical Manufacturing Plastics and Rubber Products Manufacturing Computer and Electronic Product Manufacturing Electrical Equipment, Appliance, and Component Manufacturing Furniture and Related Product Manufacturing Beverage and Tobacco Product Manufacturing Paper Manufacturing Transportation Equipment Manufacturing Nonmetallic Mineral Product Manufacturing Machinery Manufacturing Wood Product Manufacturing Petroleum and Coal Products Manufacturing Fabricated Metal Product Manufacturing Primary Metal Manufacturing
Employment and Median Earnings of Women, by Industry, 2008‐2012
Percent Women in Manufacturing and Non‐Manufacturing, 2012
* http://www.nwlc.org/resource/fair‐pay‐women‐requires‐increasing‐minimum‐wage‐and‐tipped‐minimum‐wage
* http://www.nwlc.org/resource/fair‐pay‐women‐requires‐increasing‐minimum‐wage‐and‐tipped‐minimum‐wage