
SLIDE 1
10/2/2019 1
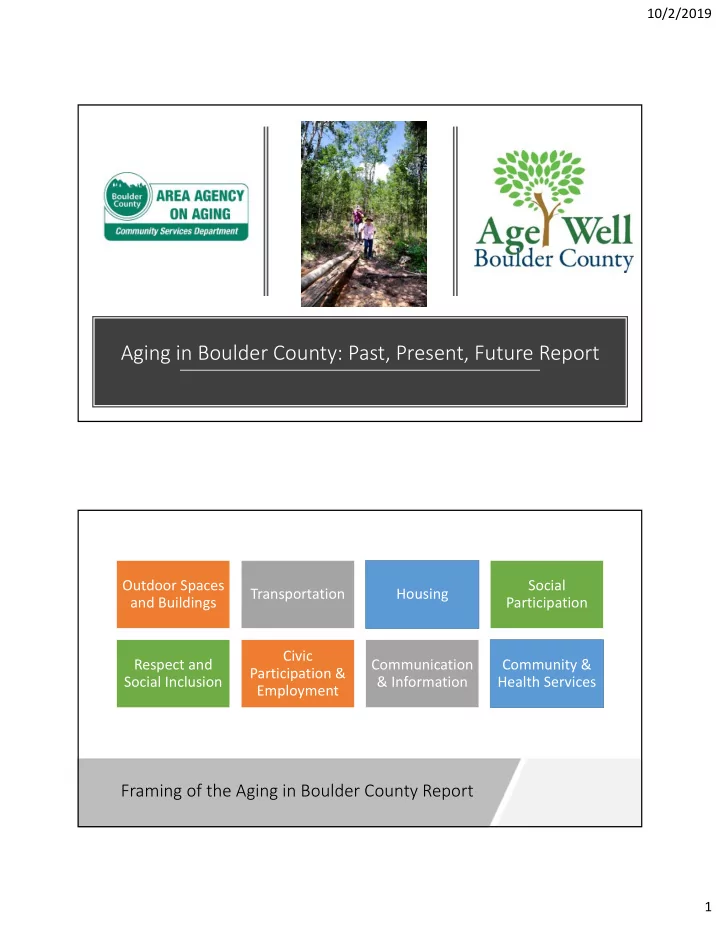
Aging in Boulder County: Past, Present, Future Report Outdoor Spaces - - PDF document
10/2/2019 Aging in Boulder County: Past, Present, Future Report Outdoor Spaces Social Transportation Housing and Buildings Participation Civic Respect and Communication Community & Participation & Social Inclusion &
10/2/2019 1
10/2/2019 2
(CASOA)
Primary
Health
AARP Secondary
10/2/2019 3
Percentage
County’s Population by Age Group
15% 26% 0% 5% 10% 15% 20% 25% 30% 35% 2010 2015 2020 2025 2030 2035 2040 2045 2050 0‐19 20‐39 40‐59 60+
10/2/2019 4
37,906 80,108 7,875 36,393 45,781 59,869 73,797 85,643 95,494 103,319 108,890 111,704 116,501 20,000 40,000 60,000 80,000 100,000 120,000 140,000 2010 2015 2020 2025 2030 2035 2040 2045 2050 60 to 79 80+ 60+
0% 20% 40% 60% 80% 100% 2012 2017
10/2/2019 5
Chronic Disease and Disability On the Rise
FPL is $12,490 for a single adult and $16,910 for two adults
185% of FPL is $23,107 for a single adult and $31,284 for two adults
10/2/2019 6
Low‐Income
transportation, and personal care are difficult to meet Mountain Residents
addressing social isolation Racial/Ethnic Minorities
for connection to services
10/2/2019 7
“…I was told as we age, we are worthless, that we contribute nothing to this city.” “We’re old and they’re waiting for us to die. I’m feeling that way.”
35.4% 47.9% 34.0% 47.8% 58.7% 64.2% 30.8% 58.9% PHYSICAL BURDEN EMOTIONAL BURDEN FINANCIAL BURDEN OVERWHELMED/EXHAUSTED
1 to 5 HRS 6+ HRS
“Caregiving is like holding onto the steering wheel and your car is going 100 miles an hour down the road and you are weaving around. You cannot let go of a single finger or everything is going to go out of control. So you stay with that focus on that one thing, you know, and all kinds of things fall apart.”
10/2/2019 8
Boulder‐Longmont MSA: Non‐medical Care Workers ‐ $13.33/hr; Nursing & Residential Care ‐ $16.85/hr
Accessibility, Affordability, Availability
Housing Transportation Services Social Isolation
10/2/2019 9
“And I just feel like across‐the‐board with every resources and service, whether it’s low income or for those with money, there’s a disconnect with what’s available to support
made harder? Why is everything always buried?”
Presentations Key informant interviews Age Well Summit
10/2/2019 10
Christine Vogel Boulder County AAA Manager Cvogel@bouldercounty.org 303‐441‐4575 More information at allagewell.com