
SLIDE 1
Cascadia High Speed Rail Corridor: Business Prospectus
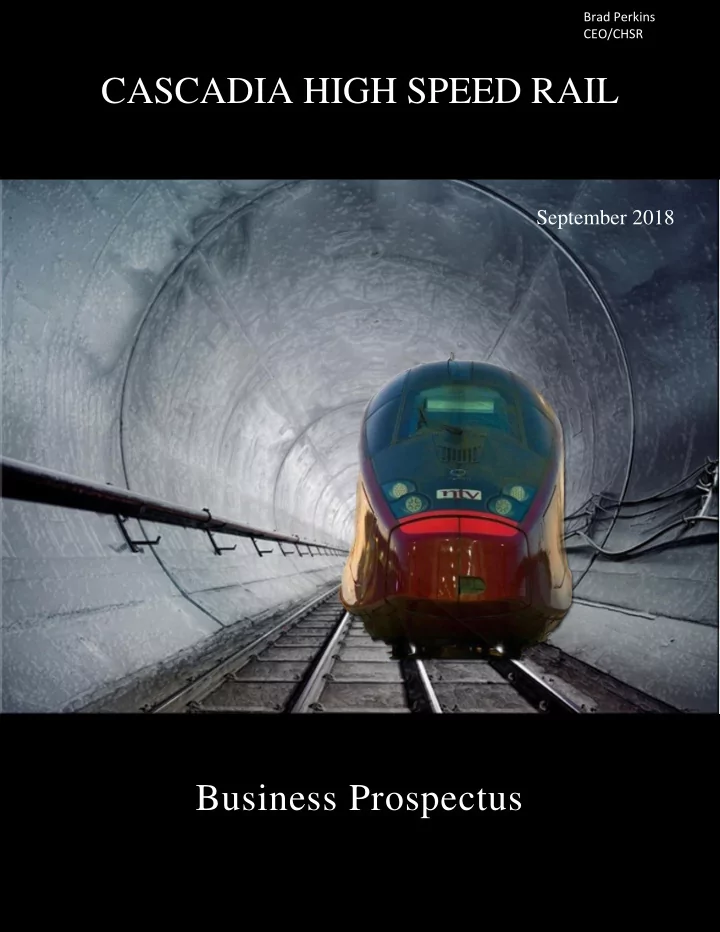
CASCADIA HIGH SPEED RAIL Business Prospectus
September 2018
Brad Perkins CEO/CHSR
CASCADIA HIGH SPEED RAIL September 2018 Business Prospectus Table - - PDF document
Brad Perkins CEO/CHSR Cascadia High Speed Rail Corridor: Business Prospectus CASCADIA HIGH SPEED RAIL September 2018 Business Prospectus Table of Contents Letter from the Chief Executive Officer 1 Section 1 Background 2 Section 2 The
Cascadia High Speed Rail Corridor: Business Prospectus
Brad Perkins CEO/CHSR
CHSR BUSINESS PROSPECTUS ii
Prepared and designed by: TEMS, Inc. Frederick, MD 21701 mail@temsinc.com
Letter from the Chief Executive Officer 1
Section 1
Background 2
Section 2
The Proposed CHSR System 7
Section 3
CHSR Complements Air Service 10
Section 4
Capital Costs 12
Section 5
Passenger Markets 14
Section 6
Express Freight Markets 17
Section 7
Transit Oriented Development 21
Section 8
Financing 26
Section 9
Economic Returns 33
Section 10
Conclusions and Next Steps 39
CHSR BUSINESS PROSPECTUS 1
LETTER FROM THE CHIEF EXECUTIVE OFFICER
This prospectus has been developed to show the potential for developing a private consortium to build a high speed rail system for the Seattle-Eugene corridor. The consortium has carefully studied the corridor and concluded that a Business Case can be developed that would produce positive cash flows and returns for the private sector, while requiring a minimum contribution from government. The scale of the potential for the private sector initiative has been enhanced by a series of events over the last thirty years that make the market for high speed rail more and more attractive. These include –
By taking advantage of these new factors a Business Plan has been developed that shows that a public/private partnership (PPP) can change the approach to financing of a new major infrastructure since the proposed system can cover all its operating costs and 80% of its capital costs -- requiring only a 20% ($3 billion) contribution from state and federal agencies. If the states of Washington and Oregon put up $1 billion each, and the US Department of Transportation (USDOT) Federal Railroad Administration (FRA) adds $1 billion (less than the grant given to Illinois for its 110 mph rail development program), the project can be developed as a PPP with the private sector funding the bulk of the cost. Cascadia High Speed Rail (CHSR) intends to create the PPP, by working with the states of Washington and Oregon, and creating a Board of Directors with both public and private representation. This initial prospectus contains an
further public and stakeholder outreach and technical studies as required to support the project. The Board is confident that the Company Business Model is appropriate to achieve the expected returns on
risk, by completing the required public outreach and technical studies needed to develop the Business Plan to Investment Grade status. To apply for shares, you will need to apply to an online application form accessible via the Company’s website or the application form attached to the prospectus. If you have any questions about how to apply for shares, please call us at the contact information below. We look forward to your participation in this most exciting project should you decide to become a partner and shareholder pursuant to the offer. Sincerely, Brad Perkins, CEO Cascadia High Speed Rail, LLC Contact Information: Brad Perkins, CEO 503-317-6455 perkinsrealty@comcast.net
CHSR BUSINESS PROSPECTUS 2
SECTION 1:
BACKGROUND
The Cascadia High Speed Rail (CHSR) Corridor has been recognized as a potential high speed rail corridor since 1992 when it was identified by USDOT FRA as one of the original five best high speed rail corridors for development.1 This decision was driven by the fact that the corridor from Seattle, WA to Eugene, OR is one of the densest corridors in the US and as such, could sustain a high speed rail
acclaimed America 2050 study2 which noted not only was the population dense, but it was hemmed in between the parallel Coastal and Cascade mountain ranges, which forces development into the form of a linear corridor on a relatively flat landscape. The major cities of the corridor are too close to each
financially needs a minimum range of over 400 miles due to high energy costs associated with landing and taking off. However, they are at an ideal distance for fast passenger rail service. Early experiments with passenger rail provided tangible evidence that this was the case, with ridership responding favorably even to slow Amtrak service, while with every rail improvement offered such as introduction of Talgo trains, the result was considerably improved ridership and revenue each
A system extension north to Vancouver BC also has great potential, but due to the more difficult geographic terrain north of Seattle as well as the need for an international border crossing, it may require a different financing structure than that of the main spine from Seattle to Eugene. The impact of this extension would be to include Everett and Bellingham in the corridor along with Vancouver BC and possibly even the Vancouver Airport, which is connected to downtown by the SkyTrain system.
1 See: https://www.fra.dot.gov/Page/P0140 2 See: http://www.america2050.org/
Heading south from Seattle WA the corridor includes SEA-TAC International Airport (the most important international airport in the Northwest), Tacoma (the second city of Washington state), Olympia (the capital of Washington state), Centralia, Kelso, Vancouver WA (a growing suburb of Portland), Portland International Airport (the first passenger and freight airport of Oregon), downtown Portland at the Rose Quarter (a major hub of the Metro region transportation system), Salem, Albany and Eugene.
HSR Train Time between Major Cities
1 hour 1 hour 50 minutes
CHSR BUSINESS PROSPECTUS 3
The corridor is connected by Interstate 5 (I-5), but this highway is chronically congested from ever- increasing volumes of traffic. Everett, WA has some
and Portland, OR is not far behind at number 12. While government has considered directly funding highway improvements and/or using tolls to shift demand, major capacity expansions of urban freeways have been found impractical, due both to the significant costs and severe environmental impacts that they would have on built-up areas of the cities.
3 See https://www.kgw.com/article/traffic/portland-traffic-
congestion-among-worst-in-us-inrix-reports/283-515262476 and https://www.seattletimes.com/seattle-news/transportation/its- worse-than-you-think-everett-leads-the-nation-in-traffic- congestion-report-says/
CHSR System will alleviate highway congestion
CHSR BUSINESS PROSPECTUS 4
Likewise, the airports of the region are also facing significant capacity constraints. Although SEA-TAC has up to now been able to effectively serve the region, SEA-TAC is completely hemmed in by development, and has no ability to add runways or expand its ground terminal capacity. The Exhibit below shows volume of inbound air freight (in millions of pounds, on the left axis) compared to the number of annual passengers (both arriving and departing, in millions, on the right axis.)
Freight and Passenger Traffic Comparison at three PNW Airports
SEA-TAC Airport
CHSR BUSINESS PROSPECTUS 5
Typically, air cargo carriers are the first to leave congested passenger hub airports, and the Exhibit above shows that this is already happening at SEA-TAC. United Parcel Service (UPS) has its hub at nearby Boeing Field (BFI), and Portland Airport (PDX) has also attained a significant position in air freight. The combined total of arriving freight at Portland and Boeing Field is 2,064 million pounds per year as compared to 1,878 million pounds at SEA-TAC. As a result, SEA-TAC has less than a 50% share of the regional air freight market4. As passenger volumes continue to grow at SEA-TAC, cargo displacement is likely to accelerate. SEA-TAC will always maintain a strong position in belly freight on passenger flights, but it is likely that most of the dedicated air cargo flights will shift to either BFI or PDX over the next 10-20 years.
4 In 2017 the population of Seattle-Tacoma-Bellevue, WA Metro Area was 3,867,046, whereas, Portland-Vancouver-Hillsboro, OR-WA Metro
Area had a population of 2,453,168. On this basis, Seattle SMSA has 61% of the combined population while Portland has 39%. The two Seattle Airports SEA-TAC+BFI together have 67.8% of the combined air freight but 83.2% of the passenger markets. Portland has 32.2% of the air freight but only 16.8% of the passengers. As a result, it can be seen that air freight is splitting between PDX and SEA-TAC roughly proportional to the relative population share of the two regions. However, SEA has a disproportionate share of passengers, reflecting its role as a regional passenger hub.
SEA-TAC Airport Portland Airport
CHSR BUSINESS PROSPECTUS 6
To make the airport capacity problems even worse, Seattle lacks an effective reliever airport strategy: Southwest Airlines wanted to avoid landing fees at SEA-TAC, which are among the highest in the nation. When Southwest in 2005 tried to move out of SEA-TAC to nearby Boeing Field5, its application was denied6 by the City of Seattle. More recently, three airlines including Southwest have been allowed to establish limited operations at Paine Field in Everett, but only two passenger gates were allowed, which falls far short of demand. Two gates are not nearly enough to establish Paine Field as an effective reliever to SEA-TAC.7 The use of Paine Field for commercial flights has caused an uproar with the adjacent town governments of Mukilteo and Edmonds, who have been able to prevent Paine Field from expanding beyond the currently approved 24 commercial flights per day. All Seattle based airports have capacity and/or environmental constraints that are going to make it difficult for them to continue growing in the future. This is due to the practical inability of any of the
TAC capacity constraints. While SEA-TAC and BFI airports have long runways, both have severe land area constraints. Air cargo can grow at BFI or SEA-TAC only if air freight can be quickly moved off the ramp to off-field cargo
enough land for development of large cargo facilities
supporting large scale air cargo operations.
5 See
https://www.kingcounty.gov/depts/transportation/airport.aspx Boeing Field (BFI) is one of the nation’s busiest non-hub airports, averaging 200,000 takeoffs and landings each year.
6 See: https://www.nytimes.com/2005/10/16/business/the-little-
airport-that-said-no-to-southwest.html and https://www.seattlepi.com/local/article/Plan-won-t-fly-Sims-kills- Southwest-s-Boeing-1184887.php
7 See: https://leehamnews.com/2018/04/09/pontifications-
limited-operations-raise-doubts-over-paine-field-airline-service/
By comparison, PDX airport has plenty of land and even has a plan for developing a third runway. As a result it is clear that PDX does have the ability to become an effective reliever for SEA-TAC. The first priority for PDX must be to secure through zoning and other means its ability to obtain the additional land that it will need for future expansion. By linking the PDX and SEA-TAC airports together, CHSR can integrate the air services available at both airports. The most likely result is that continued growth of passenger traffic at SEA-TAC will at first displace dedicated air cargo to either PDX or BFI. After this, PDX will develop into a passenger reliever airport for SEA-TAC. This will likely result in significant growth of both freight and passenger traffic at PDX
the two airports also offers a major opportunity to CHSR since it will afford the maximum flexibility for residents of the Pacific Northwest cities to choose from flight offerings at either of the two airports that are likely to continue anchoring the region for many years to come.
German high speed train connecting to Frankfurt Airport
CHSR BUSINESS PROSPECTUS 7
SECTION 2:
THE PROPOSED CHSR SYSTEM
It is clear that additional transportation capacity is already needed in the Pacific Northwest region today, and the need for even more transport capacity will only expand as a result of economic growth in the future. Intercity passenger travel demand in the corridor will increase dramatically over the next thirty years as a result of forecasted demographic growth, with an increase of 44% by 2050. Freight traffic in the corridor is likely to grow even faster given the increasing role and economics of “E-Commerce” and “just in time” logistics. More capacity for moving passengers and express freight is needed in the corridor immediately. However, given the constraints of existing modes, the pursuit of additional highway capacity or expansion of SEA-TAC International Airport would destroy substantial portions of the existing cities. This is not likely to be politically or environmentally acceptable. As a result, while the highway and air modes of transportation in the Pacific Northwest are becoming effectively gridlocked, government has not been able to come up with any effective solutions, due to its financial constraints.
High Speed Rail
CHSR BUSINESS PROSPECTUS 8
As a result, it is up to the private sector to provide a
cannot be added by any existing mode. Rather, it needs to come from a “green” transportation mode that is capable of moving large volumes of people and goods very rapidly with a very small footprint, and has the ability to be largely self-financing. A high speed rail system as proposed by CHSR only needs 50-80 feet wide rights of ways. Rail is the only existing mode of transportation that can provide a high level of service and the capacity needed while having acceptable environmental impacts. The tight footprint of rail tracks (as compared to additional highway lanes) as well as the ability to cost effectively tunnel corridors makes rail the only mode that can support economic growth in the Pacific Northwest in a sustainable, environmentally responsible way. Furthermore, since high speed rail can raise significant funds from the businesses it supports, the mode can be developed by a private/public partnership. Therefore, Cascadia High Speed Rail (CHSR) can and must be developed as a privately led initiative. By adding express freight and joint development
that will be available from passenger service, the proposed CHSR system can not only cover its
sharing, recover its capital cost as well. Passenger Rail Service: The proposed CHSR system will link the major cities and airports of the Pacific Northwest with an attractive, efficient and affordable rail system. It will add almost unlimited capacity to meet the region’s current and future transportation
and comfortable travel experience with very fast times between cities. By comparison, Amtrak’s current service is not time-competitive with auto, whereas the proposed CHSR service would be much faster than auto. This will make CHSR service very attractive and will allow CHSR to attract riders at fare levels that are high enough to recover both
average travel customer. Because Amtrak must share tracks with freight trains, its service is slower and less frequent, and unreliable compared to auto travel. The proposed CHSR service will have its own dedicated tracks, so it can run as many trains as it needs, while cutting current Amtrak schedule times by more than half. Any schedule changes to the existing Amtrak system must be negotiated and approved by four different private and public bureaucracies, which necessitates years of time and greater expense.
Dedicated Track
CHSR BUSINESS PROSPECTUS 9 Travel Time by Mode
High Speed Electric Train
CHSR BUSINESS PROSPECTUS 10
SECTION 3:
CHSR COMPLEMENTS AIR SERVICE
CHSR will compete with auto, but the high speed rail system will strongly complement and enhance air service, as it does in Britain, France, and Germany. A key aspect of the economic viability of the CHSR plan lies in its airport access strategy. As shown below, CHSR plans direct access to both the SEA- TAC and Portland (PDX) Airports with passenger stations directly underneath the main airport
would also give CHSR direct access to the PDX air cargo terminals. Since the loop through SEA-TAC will be underground, it will work for integrated baggage and belly freight, but a separate access to the SEA-TAC dedicated air cargo areas is planned. CHSR will also connect directly to the cargo areas at Boeing Field (BFI) in Seattle. Proposed CHSR service directly between the SEA- TAC and Portland airports will immediately alleviate the need for inefficient, capacity wasting short distance flights. Instead, it will afford the airlines an
integrated baggage services. This will provide a direct revenue opportunity to CHSR, since CHSR can not only share in checked baggage revenues, but can also add express parcels and air cargo, both within the Pacific Northwest, as well as in conjunction with the airlines. For example, belly freight arriving on passenger flights at SEA-TAC can be moved directly from airplanes to the rail stations using the same transfer mechanisms that are used for passenger baggage.
SEA-TAC and Portland (PDX) International Airport Loops
As a result, the proposed CHSR rail service will vastly increase the connectivity and accessibility of the airports, and will expand the market areas that each airport can effectively serve. For example, one could take a flight from one airport and return to the
if that were more convenient and take the train to SEA-TAC. As a result, the two airports could work together for taking advantage of the capacity expansion capabilities that are still available at PDX, for ensuring that the air system has enough capacity for meeting the whole regions’ future air travel needs.
Charles de Gaulle Airport Rail Station
CHSR BUSINESS PROSPECTUS 11
In the whole corridor from Vancouver, B.C. to Eugene, not including air-connect trips, high speed rail has been forecasted to carry 9.9 million riders by 2050. The core segment from Seattle to Eugene accounts for 8 million trips,
linking to airports, CHSR could also distribute air freight, express packages and parcels, the growth of which is critical to the regions’ new economy that thrives on “e” commerce and the rapid interaction associated with just-in- time manufacturing and modern day supply chains. As a result, rail can carry at least 30-50% of the forecasted ridership between now and 2050.
HSR can carry 30-50 percent of the forecasted growth in regional travel demand.
CHSR BUSINESS PROSPECTUS 12
SECTION 4:
CAPITAL COSTS
To date, two approaches have been considered for the Cascade Corridor: slow Amtrak vs. an Ultra High Speed tunneled system. Neither approach works from an economic perspective. CHSR however, finds a “sweet spot” in the middle offering a practical, affordable, implementable vision for the future of rail travel in the Pacific Northwest. Slow Speed Amtrak: To be effective, a rail service has to be both comfortable and time-competitive to auto travel. The current Amtrak Cascades service is comfortable, but because it extensively shares its tracks with freight trains, unfortunately the existing service is also slow, infrequent and unreliable. This limits the relevancy of the existing Amtrak service, rendering it an ineffective solution to meeting the region’s transportation needs. Tunneled Ultra-High Speed Trains: High speed concepts for an arrow-straight rail line goes to the
tunneling at an exorbitant capital cost. Such costs are unaffordable to the public sector as well as to the private sector. The tunneled system lacks economic justification and so can only be characterized as hypothetical concepts, not serious solutions. Unaffordable proposals do not provide reasonable solutions to meeting the region’s transportation
topography of the Pacific Northwest is not conducive to that sort of a high speed rail solution. The likely time savings of only 30 minutes for an arrow straight alignment would require at least a tripling of capital costs compared to the CHSR approach. There are good and economical options that lie between the radical extremes of the existing 42-mph average Amtrak system vs. a tunneled 250-mph high speed rail solution. The CHSR Approach: The CHSR system recognizes and appropriately balances the trade-off between capital costs and speed. For example, in the central segment of the corridor from Vancouver, WA to Olympia, WA, the CHSR plan generally follows the BNSF alignment with easements for curves. The eased alignment in this section is generally capable of
effectively engineered for unrestricted 250-mph
Both the existing Amtrak and also the proposed ultra high speed proposals miss the mark. By appropriately balancing speed vs. infrastructure cost, CHSR is able to find a “sweet spot” that optimizes the potential for effective development of the rail corridor with scenic views of the beautiful Pacific Northwest. The CHSR has a top speed of 220-mph but to keep costs reasonable, many segments would actually operate at 150 to 170 mph. Matching the right design standard to fit the market and geography of the corridor ensures that the CHSR option can be developed for half to a third of the cost for the fully tunneled 220-mph option. As a result, the CHSR approach develops an attractive and affordable option. Projected capital costs are shown in the Exhibit below. With an additional $1 billion for train equipment and a maintenance base, capital costs are estimated as $19.6 billion for a Seattle-Portland-Eugene system.
High Speed ICE Train
CHSR BUSINESS PROSPECTUS 13
It will cost an additional $3 billion to add the planned connections to the SEA-TAC and Portland airports. It is considered that because of the benefits to the airports, this cost should be split 50/50, so CHSR’s cost including its share of the airport connections would be $21.1 billion.
Updated Infrastructure Capital Cost of the Base CHSR System
The feasibility-level FRA plan did not include direct service to either SEA-TAC or Portland airports, yet it still projected an annual ridership of 6.3 million (80% of the whole corridor total of 7.9 million from Vancouver, BC to Eugene, OR) and $452 million in revenue for 2030. This was estimated to grow to 7.9 million riders and $564 million in revenue by 2050. This ridership projection was consistent with the results of FRA’s 1997 Commercial Feasibility Study8, taking into account adjustments for highway congestion, energy prices, and fare levels. Even without direct airport connections, the first cut analysis showed that CHSR could cover its own operating costs and make a substantial contribution to its own capital costs.
8 See: https://www.fra.dot.gov/eLib/details/L02519
SEGMENT SUBTOTALS On Ground Fill Flyovers Tunnels TOTAL Unit Cost mil$/mile $20.00 $20.00 $50.00 $200.00 Eugene to Portland Rose Quarter 78.8 4.1 15.8 10.4 109.1 Portland Rose Quarter to Seattle Central 43.4 5.1 58.6 48.2 155.3 TOTAL MILES 122.2 9.2 74.4 58.6 264.4 SEGMENT SUBTOTALS On Ground Fill Flyovers Tunnels Placeholders TOTAL Eugene to Portland Rose Quarter $1,576.00 $82.00 $790.00 $2,080.00 $0.00 $4,528.00 Portland Rose Quarter to Seattle Central $868.00 $102.00 $2,930.00 $9,640.00 $550.00 $14,090.00 TOTAL COST IN MILLIONS $2,444.00 $184.00 $3,720.00 $11,720.00 $550.00 $18,618.00 MILES TOTAL COST
CHSR BUSINESS PROSPECTUS 14
SECTION 5:
PASSENGER MARKETS
Planning for the CHSR system has evolved through several stages of development. A key milestone was reached in August 2016, when CHSR submitted its initial feasibility study proposal to the US Federal Railroad Administration (FRA). This FRA submittal served as the registered beginning of the current plan update. This starting point projection was updated to reflect a revised $19.6 billion capital cost. The updated estimate now suggests that the CHSR system without airport connections and at the originally assumed fare levels could self-fund 23.8% of its own capital cost at a 3% interest rate. The updated Benefit Cost ratio was estimated as 1.33 (at 3%) and 0.82 (at 7%) which satisfies FRA’s economic criteria for public investment in the rail system at 3% ROI but not at 7%. Furthermore, it was recognized that the public sector could not make this level of investment. It would need to be a public/private project with the private sector taking the lead. For this to occur, several changes would need to be made to the financial structure of the
generating additional sources of revenue to make the project attractive to private investment. The process
private rather than public funding will be addressed in the next few sections of this CHSR Prospectus. Revenue Optimization: The first cut analysis did not
attract more ridership, which increases the level of consumer surplus benefit, highway congestion relief and emissions reduction that could be achieved by the CHSR system. However, for a privately funded project, it would be important to optimize revenue to ensure an attractive return on investment. The 1997 Commercial Feasibility Study identified that the Pacific Northwest corridor could sustain the highest revenue yields in the nation, even exceeding the obtainable yields of the Northeast Corridor (NEC) due to less government jurisdictions, rail entity
highway congestion in the Pacific Northwest and lack
have only gotten worse over the past 21 years. However, for the purpose of this assessment, average revenue yields were not raised all the way to NEC levels, but have been raised by 25% from an average yield of 40¢ per mile up to 50¢ per mile. This level of increase is still not quite to a revenue optimizing level and still generates a substantial consumer surplus, congestion relief and emissions benefit. However, the fare increase does substantially improve system revenues, while moderately reducing the ridership. Revenue optimization reduced 2030 ridership from 6.3 to 5.6 million but increased revenue from $452 million to $508 million. As a result, the percentage
rises to 30.2%, covering nearly a third of the capital cost of the rail system. Completed report filed with Federal Rail Road Administration, August, 30, 2016.
CHSR BUSINESS PROSPECTUS 15 Comparative Fare Yield by Corridor, Year 2020, from 1997 CFS Report9
Adding Airport Connections: The next significant step for improving the financial performance of the CHSR system is to add rail connections to the airports. However, a particular challenge of the airport extension is that the airport authorities, rather than the rail system are likely to capture not just improved accessibility, but also any real estate and development value at the airports. Since the rail system cannot capture any of this value, it is not unreasonable to expect a capital contribution from airports themselves, especially for infrastructure and stations on the airport property itself. Airports have access to a variety
Therefore it is assumed that the rail system and airport will evenly split the $3 billion capital cost with each party contributing $1.5 billion towards the cost. The capital cost that has to be borne by the rail system itself due to these airport connections rises by $1.5 billion to a new total of $21.1 billion.
9 High Speed Ground Transportation in America, Federal Railroad Administration, 1997. See Figure 7-7 on page 7-7:
https://www.fra.dot.gov/eLib/details/L02519
CHSR BUSINESS PROSPECTUS 16
The airport connections would add a substantial ridership base from three different sources: Air Connect trips to/from the airport - Most of these are assumed to be shorter distance trips which nonetheless will likely attract high revenue yields, which existing airport shuttle service (such as Heathrow Express) have shown themselves capable of achieving. However, in some cases these would be long trips, for example a passenger from Portland may travel to SEA-TAC to catch a flight. The revenue associated with Air Connect trips can be further enhanced by integrating the baggage services, for example, by allowing passengers to check their luggage at the rail station rather than having to handle their own luggage on board the train. This way the rail system can also attract some additional revenue from the checked luggage service. These revenues would show up as part of the express freight shipping service to be described later. Airport employee trips - Typically these comprise the majority of transit mode trips to/from airports on modes like light rail, but the high speed rail system will be attractive for many of those trips as well. Code Sharing trips - This would consist primarily of trips between the PDX and SEA-TAC airports assuming that the airlines would code-share and use the rail system to replace short distance flights between the two airports. As a result of adding the airport connections, forecasted CHSR ridership more than doubles (160%) and revenue increases by 80%. Because air connect trips are shorter on average, the average trip length declines from 140 miles to 97 miles. On an apples-to-apples basis, 2030 ridership would rise from 5.6 to 14.7 million and ticket revenue would increase from $508 to $914 million. Capital cost coverage would rise to 60.2%, even taking into account the $1.5 billion increase in cost for adding the airport rail connections.
Union Station, Washington DC King’s Crossing Station, London
CHSR BUSINESS PROSPECTUS 17
SECTION 6:
EXPRESS FREIGHT MARKETS
Historical Evolution of the Freight Market: In the US, heavy freight is handled by the freight railroads, whereas lighter and more time sensitive freight has mostly been shipped by truck or air. While both BNSF and UP railroads will continue to provide double stack heavy freight10 for long haul deliveries, it is important to clarify that this technology is not suitable for express freight in corridors as short as 200 miles nor is it suitable for
and this traffic is largely not cost or time efficient for express freight and package service. The express and air freight segment is growing rapidly and has a very high service
the higher rates associated with a premium
than heavy freight, and the CHSR system has the ability to compete for it.
10 These trains are typically very heavy and move at slow speeds.
This allows railroads to be cost-competitive vs. ocean freight over long distances, typically 1,000 miles or more. Also, double stack has high terminal costs for lifting containers on and off flat cars, and also uses very heavy axle loadings.
As a result, a two-pronged approach is envisioned that is compatible with high speed passenger trains and is appropriate to the needs of express and air freight. Because of E-commerce and development of fulfillment centers, the express freight market has been growing rapidly in recent years, as fast as 15% per year and this explosive rate of growth is expected to continue through at least 2025. Demand doubles every 6-8 years. The rate of air freight growth is not quite as strong as for parcel service, but still robust at 3-5% per year. At this rate, demand doubles every 20-30 years.
Double Stack Freight is not envisioned for CHSR
CHSR BUSINESS PROSPECTUS 18
Package Express Business: this service is designed for high valued goods that can be handled manually. The service is modeled after Eurostar’s Esprit11 and British Rail’s former Red Star Parcel business. It operates as an adjunct to checked baggage service which itself can be a revenue producer for the rail system. Package express service is for light parcels, and is designed for same-day package delivery. It uses couriers to pick up and deliver packages from rail stations. Alternatively, customers can bring their packages to and from the stations if they want a lower cost, and do not want to employ a courier service. This type of operation was extensively studied and has been well documented as part of the Midwest Regional Rail System plan. While the total revenue generation capability of express parcel traffic is substantial, it is assumed that 70% of those revenues would be consumed by pickup and delivery couriers; 15% would be absorbed as station operations cost so that only a residual 15% of total revenues would be left over as a contribution to train operations. This traffic does not add much to the train operating cost, so the residual 15% net amount can be directly transferred to the rail system’s financial statement.12 As a result of adding express parcel service, projected revenues of the rail system would rise by about 6% with very little operating cost impact, so total 2030 revenue would rise from $914 to $976 million. The additional $62 million per year in cash flow would raise the percentage of self-funded capital cost to 68.5%, as a result of adding the checked baggage and express parcel service.
11 See: Freight’s pincer movement is just for starters, https://www.railmagazine.com/operations/freight/freight-s-pincer-movement-is-just-for-starters 12 In terms of modeling the financial contribution that a package express service could make, this service would be offered by a separate
subsidiary which has its own income statement and balance sheet; only the net transfer amount is shown on the rail financial statement.
Same-Day Package Express and Checked Baggage Service
CHSR BUSINESS PROSPECTUS 19
Air Cargo Business: an express cargo service would be added for extending the reach of current air cargo services. As envisioned, trains would be equipped so that they could seamlessly interoperate with aircraft and could carry air cargo containers. Dedicated trains could be operated for connecting with dedicated air cargo operations; it is also possible that baggage compartments could be provided on board regularly scheduled passenger trains that would have the ability to handle a certain number of air cargo containers. To the extent possible, air containers will be transloaded directly from aircraft to waiting trains so the containers can complete their journeys by rail, with a minimum of handling at the transfer point. The same cargo system can also be used for ground movements of less-than-truckload freight. The air and LTL cargo segments of the market generate much a higher revenue yield than does the full-truckload freight that is targeted by the freight railroads. The kinds of container equipment that can be used for integrated air cargo and LTL express services are shown below. Air cargo containers are typically handed on roller floors equipped with powered rollers. Containers are quickly and precisely loaded and unloaded by remote control13 with a minimum of manual labor. Rail equipment that would be needed for the service would consist either of standard passenger coach cars modified for express freight service, or could include specially built express freight cars that are designed especially for handling air cargo containers in dedicated high speed service. The Italian Railroad has recently announced that it is converting some of its older passenger trains to develop this kind of an express freight service14 and that each train will have the capacity of two 747’s. These high speed express freight trains would run in a combination of dedicated trains or on regular passenger trains as according to market requirements. In terms of the contribution that air cargo service could make it has been estimated that it would add about 4.8% to the revenues or $44.3 million in 2030, as compared to $18.4 million in operating cost. The additional $25.9 million per year in cash flow would raise the percentage of self-funded capital cost to 71.9%, as a result of adding the air cargo service.
13 Air cargo loading and unloading operations can be seen in the following videos:
"Airbus A330 /A340 Single LD3 Container Loading and Unloading Operation" https://youtu.be/t2Eeap54OAQ "Airport Crews loading/unloading at Kuala Lumpur (KLIA) International Airport (part 1)" https://youtu.be/n_6Jd_aYCio “Container Dolly In Operation At the Airport" https://youtu.be/VRMlKaTpM04 "A320 /A321 Cargo Loading Operations" https://youtu.be/xwTXA2IGQfs
14 High speed trainset to be converted for freight, see http://www.railwaygazette.com/news/high-speed/single-view/view/high-speed-trainset-
to-be-converted-for-freight.html
Air Container Express Services
CHSR BUSINESS PROSPECTUS 20
Ground LTL and Ecommerce Package Freight Business: This is a very similar opportunity to that for air cargo, but would target less-than-truckload and E-Commerce freight that is moving as ground cargo within the corridor. This opportunity has been estimated as about three times that of the air cargo distribution, since the amount of ground freight moving in the corridor is so much larger than the amount of air freight. Today this is largely moved by truck, but given the ability to palletize the freight for rapid loading and unloading, and the rising level of highway congestion which adversely affects trucks even more than it does autos, much of this traffic can be effectively moved by rail. This would add an additional $133 million in annual revenue in 2030 bringing the percentage of self-funded capital cost to 82.1%, as a result of adding the LTL freight traffic in air cargo containers.
CHSR BUSINESS PROSPECTUS 21
SECTION7:
TRANSIT ORIENTED DEVELOPMENT
European and Japanese experience has shown that massive Transit Oriented Development (TOD) projects are attracted to high speed rail stations. Examples include the Kings Cross, St Pancreas and London Bridge in London; and Tokyo Towers in Japan. This business model is starting to translate into United States experience as well. For example, in development of the Brightline service, Florida East Coast Industries (FECI) expects that its initial investment in rail infrastructure will also return revenue generated by real estate development around the stations15. With a strategy modeled on profitable private high speed rail projects in Japan, the company is building more than 800 high-priced rentals at its Miami station and 290 in West Palm, along with skyscrapers that will be rented out for shops and offices. The company plans to begin leasing its luxury apartments in 2018. To the extent that the value generated by the rail system can actually be captured by the rail system developers, it can add to the revenue stream associated with the development of system. As currently projected, value capture will be an important addition to the financing of the proposed CHSR. Major projects will be developed all along the corridor from Eugene to Seattle. In Seattle, Tacoma and Portland each development will likely be worth $1-3 billion; while smaller developments will also occur in the smaller communities along the line. Overall at least $10 billion of property development may be expected to occur as a direct result of the implementation of the CHSR rail system.
15 See: https://nextcity.org/features/view/florida-nimbys-america-first-private-high-speed-rail-brightline
Transit Oriented Development associated with the Brightline passenger rail service in Florida
CHSR BUSINESS PROSPECTUS 22
The development of the CHSR rail system will raise property values in the areas of the rail stations, which will result in increased property value appraisals and tax greater long term tax revenue to the municipalities. Municipalities can contribute to the development of and CHSR corridors by discounting sales of public property, zone changes and increased height limits of property surrounding stations. Overall it is assumed that value capture can contribute $88 million per year in 2030 to the rail system, which increases at a rate of 2% annually. By adding this value capture the percentage of self-funded capital cost increases to 91.5%. CHSR will create significant property development and will play an invaluable role in developing the downtown areas of Portland, Seattle, Tacoma, and Eugene. It will greatly enhance the economic prospects of all the smaller cities and towns in between. By capturing a small portion of this value creation for the rail system, the economics of the CHSR business case can be greatly enhanced.
CHSR BUSINESS PROSPECTUS 23
CHSR BUSINESS PROSPECTUS 24
CHSR BUSINESS PROSPECTUS 25
CHSR BUSINESS PROSPECTUS 26
SECTION 8:
FINANCING
The development of a new high speed passenger and express freight rail system would create an industrial base capable of paying for its operating costs and also a very large proportion (80%) of its own infrastructure
highway and air modes, the resulting congestion on both the highways and at the airports, and the higher energy and carbon prices that are likely in the future. The advantage of pursuing a private-public partnership is that it can enable the proposed Cascadia High Speed Rail system to be developed while dramatically reducing the level of needed government contributions to the project. Capital Grants: For reflecting some of the value captured by states and municipalities, it has been assumed that direct government capital grants would cover $3 billion of the cost of developing the system. This grant assistance would be reflective of the economic benefits of the rail service to the airports and the cities they serve. It is assumed that the timing of this contribution would match the timing of the capital expenditures. By reducing the portion of capital cost that has to be covered by the CHSR, the percentage of self-funded capital cost increases to 106.6%. Capital Cost Coverage Build-up: Summarizing the results of the previous sections the project financing will be built upon a series of diverse revenue streams, building up to a point where the cumulative cash flow is more than sufficient to justify private sector involvement in the project. The most critical single step needed to develop the financial viability of the passenger rail system is to develop direct rail links to the SEA-TAC and PDX airports. The two airports not only add a substantial boost of ridership and passenger revenue, but by going there also opens the door to the package express and air cargo freight business. After this, Less-than-Truckload (LTL) freight, Real Estate development income, and the assumed small share of direct capital funding of infrastructure costs rounds out the ability of the project to not only repay all its debt
this prospectus.
CHSR BUSINESS PROSPECTUS 27
Project Financing: Since the overall project has a 2018 $886 million positive Net Present Value (NPV) at a 3% real interest rate, the interest rate was adjusted to find the Internal Rate of Return (IRR) that is the level of interest rate that would result in a zero NPV. This interest rate was found to be 3.39% real or over a 5% nominal interest rate, based on the overall project assumptions. Effective Return on Equity: In terms of how this could be financed, it has been assumed that 20% of the project would be financed by equity, whereas 80% of the financing would take the form of debt, which can currently be issued at a real interest rate of 1.18% (plus 2% assumed inflation, or 3.18% nominal.) It is also assumed that this debt would be tax deductible at a corporate tax rate of 25.7%, which includes both Federal and State taxes. Based
Weighted Average Cost of Capital = WACC for 1.18% debt rate = 20% (13.4%) + 80% (1.18%) (100% - 25.7%) = .0269 + .00944 * 0.743 = .0339 The project would produce real return on equity of 13.4% per year and a nominal return of 15.4%, assuming that the interest rate for debt remains at 1.18% real; 80% debt/20% equity financing is used and that a 25.7% corporate tax rate applies to the cost of the interest payments. If the debt interest rate were to rise by 1 point to a real rate of 2.18% the WACC changes as follows: Weighted Average Cost of Capital = WACC for 2.18% debt rate = 20% (10.5%) + 80% (2.18%) (100% - 25.7%) = .0209 + .01744 * 0.743 = .0339 With the higher debt interest rate, the project would still produce real return on equity of 10.5% per year and a nominal return of 12.5%, assuming that the interest rate for debt rises to 2.18% real; 80% debt/20% equity financing is used and that a 25.7% corporate tax rate applies to the cost of the interest payments. Statement of Cash Flows: The exhibits on the following pages show the projected cash flows associated with the development of CHSR project from 2018 through 2055.
CHSR BUSINESS PROSPECTUS 28 Projected CHSR Cash Flows (Constant 2017 Dollars @ 3.39% Discount Rate)
Note: All Figures in Millions of Dollars *Net Present Value (NPV) *Internal Rate of Return (IRR)
CHSR BUSINESS PROSPECTUS 29 Projected CHSR Cash Flows (Constant 2017 Dollars @ 3.39% Discount Rate)
Note: All Figures in Millions of Dollars *Net Present Value (NPV) *Internal Rate of Return (IRR)
CHSR BUSINESS PROSPECTUS 30 Projected CHSR Cash Flows (Constant 2017 Dollars @ 3.39% Discount Rate) cont.
Note: All Figures in Millions of Dollars *Net Present Value (NPV) *Internal Rate of Return (IRR)
CHSR BUSINESS PROSPECTUS 31 Projected CHSR Cash Flows (Constant 2017 Dollars @ 3.39% Discount Rate) cont.
Note: All Figures in Millions of Dollars *Net Present Value (NPV) *Internal Rate of Return (IRR)
CHSR BUSINESS PROSPECTUS 32 Projected CHSR Cash Flows (Constant 2017 Dollars @ 3.39% Discount Rate) cont.
Note: All Figures in Millions of Dollars *Net Present Value (NPV) *Internal Rate of Return (IRR)
CHSR BUSINESS PROSPECTUS 33
SECTION 9:
ECONOMIC RETURNS
Economic Results: The exhibit below and on the following pages recast the financial cash flows into economic
the non-user benefits, which include congestion relief and emissions reduction from the air and highway modes. Also, government grant support as a funding mechanism has been removed since it is considered a transfer payment and not an actual benefit of the system. Also, the external benefits of the freight system consisting of reduced truck traffic on the interstate highways have not yet been calculated; current estimates are for passenger traffic only, so the Benefit Cost results are by any means conservative. The resulting benefit cost ratio was improved from 1.33 to 2.31 (at 3%) and from 0.82 to 1.52 (at 7%) in spite of the added $3 billion in cost for linking to the SEA-TAC and Portland airports, as shown in the following exhibit. The Economic Internal Rate of Return (EIRR) was estimated at a very robust 10.05% which means that this project is extremely attractive for investment by both the public and private sectors. See the following economic cash flows (pages 34-38). This easily justifies public participation in and support of the project in view of the very large magnitude of the public benefits associated with this project.
Economic Analysis Summary (3% and 7% Discount Rate)
Note: All Figures in Millions of Dollars *Net Present Value (NPV) *Internal Rate of Return (IRR)
CHSR BUSINESS PROSPECTUS 34 CHSR Economics (Constant 2017 Dollars @ 10.05% Discount Rate)
Note: All Figures in Millions of Dollars *Net Present Value (NPV) *Internal Rate of Return (IRR)
CHSR BUSINESS PROSPECTUS 35 CHSR Economics (Constant 2017 Dollars @ 10.05% Discount Rate) cont.
Note: All Figures in Millions of Dollars *Net Present Value (NPV) *Internal Rate of Return (IRR)
CHSR BUSINESS PROSPECTUS 36 CHSR Economics (Constant 2017 Dollars @ 10.05% Discount Rate) cont.
Note: All Figures in Millions of Dollars *Net Present Value (NPV) *Internal Rate of Return (IRR)
CHSR BUSINESS PROSPECTUS 37 CHSR Economics (Constant 2017 Dollars @ 10.05% Discount Rate) cont.
Note: All Figures in Millions of Dollars *Net Present Value (NPV) *Internal Rate of Return (IRR)
CHSR BUSINESS PROSPECTUS 38 CHSR Economics (Constant 2017 Dollar @ 10.05% Discount Rate) cont.
Note: All Figures in Millions of Dollars *Net Present Value (NPV) *Internal Rate of Return (IRR)
CHSR BUSINESS PROSPECTUS 39
SECTION 10: CONCLUSION AND NEXT STEPS
There are three possible options for the future development of rail service in the Pacific Northwest: The current Amtrak rail service is not able to divert enough traffic away from the highway to offer any significant relief to highway
service is inadequate to meet the needs of the corridor. An arrow straight 220-mph or better tunneled alignment, while theoretically possible from an engineering point of view, is too expensive ($40 billion) to build.16 However, an expanded and faster CHSR rail service with its own tracks and direct connections to the airports could attract significant ridership as well as move significant quantities of express freight. This option can be developed by the private sector at an affordable capital cost. This last option shows how the project can be built and operated by the private sector with only a very limited capital cost contribution by the public sector. CHSR would not only cover its operating cost but could also make an 80% or better contribution to its
come up with is 20% to 30% of the total project
justified in view of the strong benefit cost results of 2.31 (at 3%) and 1.52 (at a 7% interest rate). This contribution could, in theory consist of a $1 billion commitment each from the states of Washington to Oregon, matched with a $1 billion Federal contribution.
16 WSDOT: Ultra High-Speed Ground Transportation Study, CH2M
Hill, Inc., February 2018
The project as defined would be trend setting, especially since California has been pursuing its project as a purely public project; and the Brightline in Florida is a purely private project; CHSR is unique in expanding its capabilities both privately and publicly to include: Airports Express Freight Air Cargo Transit Oriented Development This is reflective of the highly successful business approaches taken in the UK and Japan where transit
development becomes an essential component of the rail financing plan. Given the extreme traffic congestion already existing in the region as well as rising energy and carbon prices in the future, the potential of CHSR is strong enough in fact to enable the system to be developed with private funding. Investment in rail is in fact the most appropriate transportation choice for the region, and the effort to develop such a rail system must be led by the private sector.