
SLIDE 1
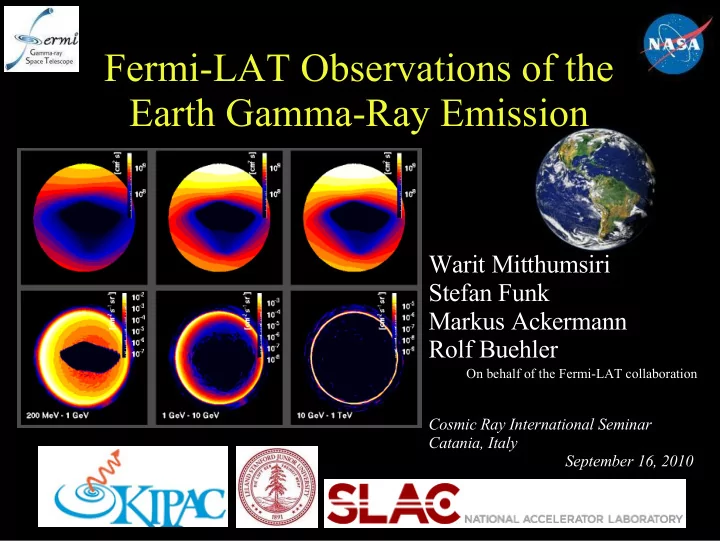
Fermi-LAT Observations of the Earth Gamma-Ray Emission
Warit Mitthumsiri Stefan Funk Markus Ackermann Rolf Buehler
On behalf of the Fermi-LAT collaboration
Cosmic Ray International Seminar Catania, Italy September 16, 2010
Fermi-LAT Observations of the Earth Gamma-Ray Emission Warit - - PowerPoint PPT Presentation
Fermi-LAT Observations of the Earth Gamma-Ray Emission Warit Mitthumsiri Stefan Funk Markus Ackermann Rolf Buehler On behalf of the Fermi-LAT collaboration Cosmic Ray International Seminar Catania, Italy September 16, 2010 1 Production
On behalf of the Fermi-LAT collaboration
Cosmic Ray International Seminar Catania, Italy September 16, 2010
Diagrams taken from:
Dominant gamma-ray production mechanisms are Bremsstrahlung of e- and e+ (below ~50 MeV) and the decay of pions and kaons (higher energy)
Data
photons (P6V3 Diffuse)
= 80 deg North East
LAT
1 GeV Exposure Map nadir = 0 deg nadir
Exposure
between 80 MeV and 1 TeV
low exposure
photon
More exposure in the north East-West effect clearly visible, getting smaller at higher energy
–
Softer for the inner part of the earth because the forward-scattered secondaries tend to have higher energy than the backward-scattered
E > 30 GeV with the fitted spectral index of -2.79 +/- 0.06
–
Good agreement with the cosmic ray (CR) spectral index of -2.75
previous measurement by SAS-2
rim (60 < < 75)
–
North = 0 deg
–
East = 90 deg
–
South = 180 deg
–
West = 270 deg
stronger at low energy as expected
can be fitted well with a flat line
nadir
deg, rim at ~ 68 deg
the PSF of each energy bin
narrower for higher energy
x-scale for the two bottom plots
function of nadir angle is scaled to compare with the line-of-sight atmospheric column density calculated from 2 models
the atmosphere is thin enough for the interactions to be in the “thin target regime,” resulting in good correlations between PSF- deconvolved gamma-ray intensity and atmospheric column density
becomes optically thick for gamma ray
nadir
68.6 < < 68.9 deg (thin target regime) compared with scaled proton intensity
into that of gamma ray, and we assume the same energy conversion factor
intensity by 0.7 to match that of gamma-ray at 1 GeV
scaled proton intensity shows good correlations (shown in the inset)
nadir
– Add more than 3 decades
from 200 MeV to 500 GeV
– The rim spectral index
above ~10 GeV follows that of the CR
– The east-west effect is observed up to 30 GeV – The radial profile can be resolved for E > 10 GeV and can be used to study
CR-atmosphere interaction
– The Earth gamma ray proves useful for instrumental calibrations