
SLIDE 1
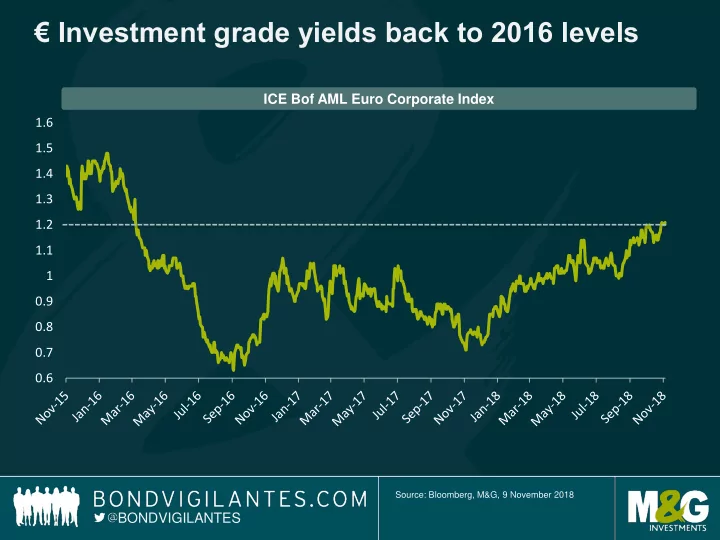
€ Investment grade yields back to 2016 levels
Source: Bloomberg, M&G, 9 November 2018
BONDVIGILANTES 0.6 0.7 0.8 0.9 1 1.1 1.2 1.3 1.4 1.5 1.6 ICE Bof AML Euro Corporate Index
Investment grade yields back to 2016 levels ICE Bof AML Euro - - PowerPoint PPT Presentation
Investment grade yields back to 2016 levels ICE Bof AML Euro Corporate Index 1.6 1.5 1.4 1.3 1.2 1.1 1 0.9 0.8 0.7 0.6 Source: Bloomberg, M&G, 9 November 2018 BONDVIGILANTES US high yield valuations have adjusted as of late
Source: Bloomberg, M&G, 9 November 2018
BONDVIGILANTES 0.6 0.7 0.8 0.9 1 1.1 1.2 1.3 1.4 1.5 1.6 ICE Bof AML Euro Corporate Index
Source: Bloomberg, Bank of America Merrill Lynch US High Yield Index, 31 October 2018
BONDVIGILANTES High yield spreads widen from post-crisis tights October saw yields hit 7% for first time since 2016 300 320 340 360 380 400 420 US high yield credit spread (bps) 351 bps 5.8% 6.0% 6.2% 6.4% 6.6% 6.8% 7.0% 7.2% US HY yield to maturity
Source: Bank of America Merrill Lynch Global Research, 30 June 2018. *Net Debt/LTM EBITDA. **LTM EBITDA/Net LTM interest expense
BONDVIGILANTES
2.5 3.5 4.5 5.5 6.5 7.5 Net leverage multiple*
US HY net leverage US HY ex commodities net leverage
1.0 2.0 3.0 4.0 5.0 Interest coverage multiple**
US HY interest coverage US HY coverage ex commodities
LEVERAGE INTEREST COVERAGE
Source: Bank of America Merrill Lynch, 31 October 2018
BONDVIGILANTES
Gross high yield issuance is down So is net issuance
20 40 60 80 Net US HY cumulative Issuance in USD billions
2013 2014 2015 2016 2017 2018
50 100 150 200 250 300 Gross US HY cumulative Issuance in USD billions
2013 2014 2015 2016 2017 2018
B O N D V I G I L A N T E S
Source: Bloomberg as of 9 November 2018.