
SLIDE 1
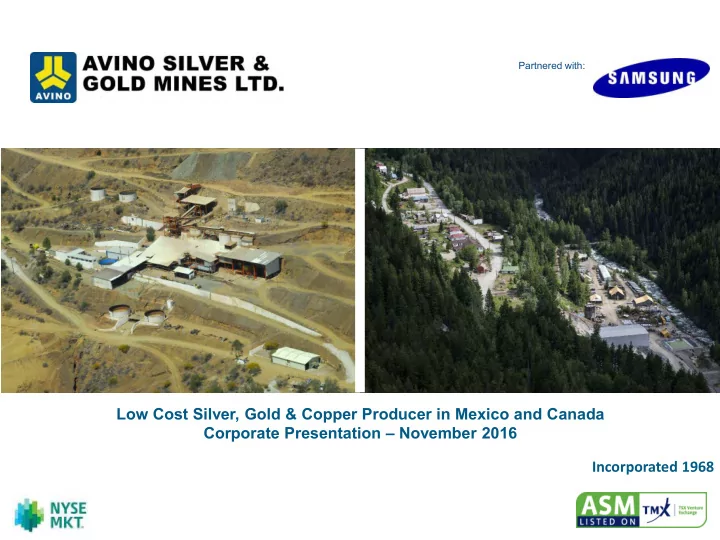
Incorporated 1968
Partnered with:
Low Cost Silver, Gold & Copper Producer in Mexico and Canada Corporate Presentation – November 2016
Low Cost Silver, Gold & Copper Producer in Mexico and Canada - - PowerPoint PPT Presentation
Partnered with: Low Cost Silver, Gold & Copper Producer in Mexico and Canada Corporate Presentation November 2016 Incorporated 1968 Cautionary Disclaimer: Forward-Looking Statements Safe Harbour Statement - This presentation contains
Incorporated 1968
Partnered with:
Low Cost Silver, Gold & Copper Producer in Mexico and Canada Corporate Presentation – November 2016
Safe Harbour Statement - This presentation contains "forward-looking information" and "forward-looking statements" (together, the "forward looking statements") within the meaning of applicable securities laws and the United States Private Securities Litigation Reform Act of 1995, including our belief as to the extent and timing of various studies including the PEA and exploration results, the potential tonnage, grades and content of deposits, and timing, and establishment and extent of resource estimates. These forward- looking statements are made as of the date of this presentation and the dates of technical reports, as applicable. Readers are cautioned not to place undue reliance on forward- looking statements, as there can be no assurance that the future circumstances, outcomes or results anticipated in or implied by such forward-looking statements will occur or that plans, intentions or expectations upon which the forward-looking statements are based will occur. While we have based these forward-looking statements on our expectations about future events as at the date that such statements were prepared, the statements are not a guarantee that such future events will occur and are subject to risks, uncertainties, assumptions and other factors which could cause events or outcomes to differ materially from those expressed or implied by such forward-looking statements. Such factors and assumptions include, among others, the effects of general economic conditions, the prices of gold, silver, and copper, changing foreign exchange rates and actions by government authorities, uncertainties associated with legal proceedings and negotiations and misjudgments in the course of preparing forward-looking information. In addition, there are known and unknown risk factors which could cause our actual results, performance or achievements to differ materially from any future results, performance or achievements expressed or implied by the forward-looking statements. Known risk factors include risks associated with project development; the need for additional financing;
countries; environmental liability claims and insurance; reliance on key personnel; the potential for conflicts of interest among certain of our officers, directors or promoters with certain other projects; the absence of dividends; currency fluctuations; competition; dilution; the volatility of our common share price and volume; tax consequences to U.S. investors; and other risks and uncertainties. Although we have attempted to identify important factors that could cause actual actions, events or results to differ materially from those described in forward-looking statements, there may be other factors that cause actions, events or results not to be as anticipated, estimated or intended. There can be no assurance that forward-looking statements will prove to be accurate, as actual results and future events could differ materially from those anticipated in such statements. Accordingly, readers should not place undue reliance on forward-looking statements. We are under no obligation to update or alter any forward-looking statements except as required under applicable securities laws. Cautionary Note to United States Investors - The information contained herein and incorporated by reference herein has been prepared in accordance with the requirements of Canadian securities laws, which differ from the requirements of United States securities laws. In particular, the term "resource" does not equate to the term "reserve". The U.S. Securities and Exchange Commission's (the "SEC") disclosure standards normally do not permit the inclusion of information concerning "measured mineral resources", "indicated mineral resources" or "inferred mineral resources" or other descriptions of the amount of mineralization in mineral deposits that do not constitute "reserves" by SEC standards, unless such information is required to be disclosed by the law of the Company's jurisdiction of incorporation or of a jurisdiction in which its securities are traded. U.S. investors should also understand that "inferred mineral resources" have a great amount of uncertainty as to their existence and great uncertainty as to their economic and legal feasibility. Disclosure of "contained ounces" is permitted disclosure under Canadian regulations; however, the SEC normally only permits issuers to report mineralization that does not constitute "reserves" by SEC standards as in place tonnage and grade without reference to unit measures. Neither the TSX Venture Exchange nor its Regulation Services Provider (as that term is defined in the policies of the TSX Venture Exchange) accepts responsibility for the adequacy
Company as required by NI 43-101. These qualified persons have reviewed the technical information concerning the properties contained in this presentation for accuracy and have authorized its disclosure. The Company expressly disclaims any obligation to update any forward-looking statements except as required under applicable securities laws.
2
3
4
The Avino Mine was founded by Spaniards in 1558 and was one of the first Spanish mines in Mexico The Avino deposit first was discovered by Spanish nobleman Juan de Tolosa and later developed by Captain Francisco de Ibarra of Cortez’s army.
4
Q3 2016 Q32016 Q32015 Change Revenues $13.2M $5.02M 163% Mine Operating Income $6.0M $2.2M 172% Total equity $68M $52M 32% Net Income (Loss) $1.2M $(.06M) 274% Cash $14.9M $9.1M 63% Working Capital $21.7M $11.5M 88%
7
¹ Metal production is expressed in terms of silver equivalent ounces, (oz Ag Eg), the formula for which depends on the copper, gold and silver metal prices used in each period and hence are only indicative.
8
Average Realized Silver Price per Ounce ($US)
Average Realized Gold Price per Ounce ($US)
9
10
See slide 39 for footnotes
500,000 1,000,000 1,500,000 2,000,000 2,500,000 3,000,000 3,500,000 4,000,000 2011 2012 2013 2014 2015 2016 2017 2018
147,001 253,450 895,240 1,342,150 3,020,348
11
See slide 39 for footnotes
YTD 2016 2015 2014 2013 2012 Revenue ($CAD) $27.9 M $19.1 M $19.3 M $16.1 M $2.3 M Mine operating income ($CAD) $11.0 M $8.1 M $7.9 M $7.1 M $0.8 M Earnings for the period ($CAD) $0.74 M $0.48 M $2.5 M $0.85 M ($1.3 M) Earnings per share ($CAD) $0.02 $0.01 $0.08 $0.03 ($0.05) Cash cost¹ per Ag Eq. ounce² ($CAD) $11.12 $8.45 $9.29 $10.16 $14.22 All-in sustaining cash cost¹ per AgEq ounce² ($CAD) $13.85 $12.14 $12.24 $14.39 N/A Cash cost¹ per Ag Eq. ounce² ($USD) $8.41 $6.61 $8.41 N/A N/A All-in sustaining cash cost¹ per AgEq ounce²($USD) $10.48 $9.49 $11.08 N/A N/A
12
See slide 39 for footnotes
$0 $2 $4 $6 $8 $10 $12 $14 $16 $18
Avino First Majestic Silver Corp. Fortuna Silver Mines Inc. Great Panther Silver Ltd. Pan American Silver Corp. Endeavor Silver Corp. Americas Silver Corp.
$6.61 $7.87 $6.60 $7.50 $9.70 $8.39 $12.75 $2.88 $5.56 $6.96 $6.26 $5.22 $7.23 $4.41
Cash Cost General, Administrative and Other Expenses
$9.49 $13.43 $13.56 $13.76 $15.62 $14.92 $17.16
13
$0 $5,000,000 $10,000,000 $15,000,000 $20,000,000 $25,000,000 $30,000,000 $35,000,000 YTD 2016 2015 2014 2013 2012 2011 $7,419,982 $22,466,988 $15,528,440 $1,085,286 $2,507,506 $1,558,406 $8,127,723 $8,492,613 $8,667,934 $5,234,381 $1,011,722 $4,012,984 E&E Expenditures PP&E Expenditures
USD$5.6M
See slide 39 for footnotes
USD$3.5 mil USD$6.3 mil USD$24.2M USD$31.0M USD$15.5M $3,969,242 $1,541,419 $5,510,661 $2,506,503 $1,011,317 $3,517,820 $1,117,953 $5,391,937 $6,509,889 $17,155,821 $9,576,333 $26,732,154 $28,726,291 $10,858,655 $39,584,946 E&E (CAD): PP&E(CAD): Total(CAD): $9,812,185 $10,748,101 $20,560,286
14
In July 2015, Avino signed a term facility agreement with Samsung C&T U.K. Limited. For the sale of Avino Mine concentrate. Terms of the Agreement:
36 months
using Avino's future shipments of concentrates; Avino made an initial repayment of US$666,666 in June 2016, and will make remaining repayments with interest in 14 equal monthly instalments commencing June 2017 and ending July 2018
gold, less treatment, refining, shipping and insurance charges
shares of Avino’s wholly owned subsidiary Bralorne Gold Mines Ltd.
does not include concentrates produced from the San Gonzalo Mine, however, a separate agreement, also with Samsung, is currently in place for the sale of San Gonzalo concentrate.
15
Gary Robertson Chairman and Independent Director 32 years experience in the financial industry, top financial planner at Hollis Wealth Advisory Services Inc. David Wolfin President, CEO and Director 30 years experience in mining and finance, geology, metallurgy, worked on the floor of the VSE and has lead a number of successful public companies. Carlos Rodriquez Chief Operating Officer 27 years technical experience in
exploration, a graduate of the Colorado School of Mines in mineral exploration. Malcolm Davidson, CPA, CA Chief Financial Officer 13 years experience in financial reporting, compliance, corporate taxation and public accounting practice. Jasman Yee, P.Eng Director, Project Manager and Metallurgist 45 years technical experience as practical mineral processing engineer and a chemical Engineer graduate from UBC. Ross Glanville, BASc, Peng, MBA, CGA, CAMV Independent Director 46 years experience in mining, exploration and development in Canada and Internationally. Has worked with Wright Engineers, Giant Bay Resources and is well respected in the industry for his fairness
Fred Sveinson, B.A., B.Sc., P.Eng Senior Mining Advisor - Bralorne 40 years experience as a professional mining engineer in Canada and Internationally in the development, construction and operation of mines including Sr. Mgmt at Echo Bay, Dynatec, SNC Lavalin and Tetra Tech. Michael Baybak Director 28 years serving as a Director
Chris Sampson, P.Eng Consulting Geologist 48 years experience working
projects worldwide. Andrew Kaplan Capital Market Strategist 25 years experience in deal structures, M&A, trading and Investor Relations.
16
17
18
Sierra Madre Silver belt
volcanic caldera which hosts numerous low sulfidation epithermal veins, breccias, stock work and silicified zones
porphyry” environment
samples, airborne survey, satellite imagery, data from ongoing drilling and historic data are all currently being compiled
remain
19
YTD 2016 Production 1,226,105 oz AgEq² 609,836 oz AG 2,152 oz Au 3,450,940 Lbs Cu Average Annual Production (1998 – 2001) 1.6M oz AgEq² Q3Consolidated all-in Sustaining cost (“AISC”) CAD$13.83 US$9.13 YTD 2016 AISC*: CAD $14.78 US $11.18 *Commercial production achieved in April 2016
See Slide 39 for footnotes
between 1974 and 2001
leading up to the shut down in 2001
US$283/oz, Copper US$0.65/lb)
in 2015, but was classified as a recovery of exploration and evaluation expenditures
500,000 1,000,000 1,500,000 2,000,000 2,500,000
1998 1999 2000 2001 Mine Closed 2015
2.0 2.1 2.1 1.9 1.8
Silver Equivalent² Production 1998 – 2001, 2015 Silver Production 1998-2001, 2015
500,000 1,000,000
1998 1999 2000 2001 Mine Closed 2015 .875 .987 .912 .853 .717
2,000 4,000 6,000 8,000 10,000
8,710 7,631 7,953 5,080 2,757
1,000,000 2,000,000 3,000,000 4,000,000 5,000,000 2.8 3.0 3.4 3.6 4.7
Gold Production 1998-2001, 2015 Copper Production 1998 – 2001, 2015
20
Overall Strike Length: 1.6 KM Width: 10 – 50 M (originally 180 M at surface)
mineralization
12 approx. 250 metres below surface
program in gap zone between Elena Tolosa and San Luis
effective long hole, sub-level caving (retreat)
Current Mining strike length: 460 m, avg width 30 m
Level 12
Current Exploration
21
previous open pit operation when recovery rates were low due to conventional milling methods of the time
gold
production decision for an agglomerated heap leach Merrill-Crowe precipitation operation
TSF is being constructed to allow the oxide tailings project to proceed
confidence and overall silver and gold ounces contained in the resource
Grade Metal Contents Resource Category Cut-off (AgEQ g/t) Metric Tonnes AgEQ g/t Ag g/t Au g/t Cu% AgEq Million Tr Oz Ag Million Tr Oz Au Thousand Tr Oz Cu T Indicated 50 1,330,000 124 98 0.46 5,302,293 4.2 19.8 Inferred 50 1,810,000 113 88 0.44 6,575,782 5.1 25.6
: Mineral resources which are not mineral reserves do not have demonstrated economic viability. The estimate of mineral resources may be materially affected by environmental, permitting, legal, title, taxation, sociopolitical, marketing, or other relevant issues. The quantity and grade of reported Inferred resources in this estimation are uncertain in nature and there has been insufficient exploration to define these Inferred resources as an Indicated or Measured mineral resource and it is uncertain if further exploration will result in upgrading them to the Indicated or Measured mineral resource category.
500,000 1,000,000 1,500,000 Y1 Y2 Y3 Y4 Y5 1,390,760 1,390,760 1,390,760 1,390,760 1,390,760
Estimated Annual Production (oz Ag Eq.)
22
YTD 2016 Production 760,860 oz AgEq² Q3 2016 Cash Cost per oz Ag Eq² - US$8.64 Q32016 AISC per oz Ag Eq² - CAD$11.27
Mineral resources which are not mineral reserves do not have demonstrated economic viability. The estimate of mineral resources may be materially affected by environmental, permitting, legal, title, taxation, sociopolitical, marketing, or other relevant issues. The quantity and grade of reported Inferred resources in this estimation are uncertain in nature and there has been insufficient exploration to define these Inferred resources as an Indicated or Measured mineral resource and it is uncertain if further exploration will result in upgrading them to the Indicated or Measured mineral resource category.
system more than 2.5m in width
management @ 250 TPD in Q4 2012
YTD 2016 2015 2014 2013 Tonnes Milled 79,295 121,774 70,525 78,415 Feed Grade Silver (g/t) 268 279 337 288 Feed Grade Gold (g/t) 1.29 1.48 1.88 1.34 Recovery Silver (%) 83% 83% 84 83 Recovery Gold (%) 71% 75% 78 73 Total Silver Produced (oz) calculated 582,868 907,384 724,931 602,233 Total Gold Produced (oz) calculated 2,386 4,326 3,740 2,473 Total Silver Equivalent² Produced (oz) 760,860 1,218,351 958,702 751,462 YTD Cash Cost¹ per oz Ag Eq.²(CAD) $9.14 $8.47 $9.03 $9.78 YTD All in Sustaining Cash Cost¹ per oz Ag Eq.² (CAD) $12.42 $12.15 $11.96 $14.15
500,000 1,000,000 1,500,000
2012 2013 2014 2015 151,372 751,462 958,702 1,218,351 San Gonzalo Mine Ag Eq.oz² Production)
Under National Instrument 43-101, the Company is required to disclose that it has not based its production decisions on NI 43-101-compliant reserve estimates, preliminary economic assessments, or feasibility studies, and historically projects without such reports have increased uncertainty and risk of economic viability. The Company's decision to place a mine into operation at levels intended by management, expand a mine, make
internal non-public Company data, and on reports based on exploration and mining work by the Company and by geologists and engineers engaged by the Company. The results of this work are evident in the Company's discovery of the San Gonzalo resource, and in the Company's record of mineral production and financial returns since operations at levels intended by management commenced at the San Gonzalo Mine in 2012. This approach is being applied for the advancement of the Avino Mine project, for which similar risks and uncertainties have been identified . 23
24
Historic Production:
428,715 tons Historic Production
3,600,000 tons Historic Production
2,384,000 tons
25
M-9960 Vein BK-9870 Vein BK Vein Alhambra (BK-9790) Vein
26
Measured Indicated Measured and indicated Inferred Tons Au
Au Ounces Tons Au
Au Ounces Tons Au
Au Ounces Tons Au
Au Ounces
Total
45,922 0.36 16,643 227,201 0.32 74,885 273,123 0.33 91,528 363,527 0.22 83,900
Mineral resources which are not mineral reserves do not have demonstrated economic viability. The estimate of mineral resources may be materially affected by environmental, permitting, legal, title, taxation, sociopolitical, marketing, or other relevant issues. The quantity and grade of reported Inferred resources in this estimation are uncertain in nature and there has been insufficient exploration to define these Inferred resources as an Indicated or Measured mineral resource and it is uncertain if further exploration will result in upgrading them to the Indicated or Measured mineral resource category. The mineral resource estimate is classified in accordance with the Canadian Institute of Mining, Metallurgy and Petroleum's "CIM Definition Standards - For Mineral Resources and Mineral Reserves" incorporated by reference into National Instrument 43-101 "Standards of Disclosure for Mineral Projects". Mineral Resources are reported at cut-off grades 0.1 ounces per ton gold.
Updated Resource Estimate
27
developed, permitted up to 500 tpd, current mine plan targeting 300 tpd
stope mining to the more cost effective mechanized long hole mining
2015 (pictured)
7,793 meters
processing have been submitted
scoop trams (pictured) and a rock breaker from Sandvik and a new loader from Caterpillar, microfiltration water treatment system, women's dry.
28
29
30
Analyst Coverage Company Analyst Cantor Fitzgerald Canada Rob Chang Euro Pacific Capital Inc. Bhakti Pavani H.C. Wainwright & Co. Heiko Ihle Noble Financial Michael Heim Roth Capital Partners Joe Reagor News Letter Coverage Publication Writer
Newsletter Jay Taylor Gold Newsletter Brien Lundin Seeking Alpha Various Smallcap-Investor Joe Brunner Struthers Resource Stock Report Ron Struthers The Morgan Report David Morgan Agora Financial Byron King Oxford Club Sean Broderick
30
31
32
CAD USD Market capitalization $144.4M $107.2M 52 week $1.03 - $4.05 $0.71 - $3.14 Shares Outstanding – 45.2 M (49.2M Fully Diluted) Major Shareholders Avino Management Bard Associates Inc. Aegis Financial Corp Renaissance Technologies LLC Deutsche Bank AG KCG Holdings, Inc.
32
32
Note: Mineral resources which are not mineral reserves do not have demonstrated economic viability. The estimate of mineral resources may be materially affected by environmental, permitting, legal, title, taxation, sociopolitical, marketing, or other relevant issues. The quantity and grade of reported Inferred resources in this estimation are uncertain in nature and there has been insufficient exploration to define these Inferred resources as an Indicated or Measured mineral resource and it is uncertain if further exploration will result in upgrading them to the Indicated or Measured mineral resource category.
Grade Metal Contents
Resource Category Deposit Cut-off (AgEQ g/t) Metric Tonnes AgEQ g/t Ag g/t Au g/t Cu% Ag Million Tr Oz Au Thousand Tr Oz Cu T Measured Avino System 55 950,000 143 74 0.33 0.69 2.3 10.0 6,550 Measured San Gonzalo 125 170,000 357 272 1.50 0.00 1.5 8.2 Total Measured All Deposits 1,120,000 176 105 0.51 0.58 3.8 18.2 6,550 Indicated Avino 55 500,000 129 68 0.36 0.56 1.1 5.7 2,800 Indicated San Gonzalo 125 320,000 310 237 1.30 0.00 2.4 13.3 Indicated Oxide Tailings 50 1,330,000 124 98 0.46 0.00 4.2 19.8 Total Indicated All Deposits 2,150,000 152 111 0.56 0.13 7.7 38.8 2,800 Total Measured & Indicated All Deposits 3,270,000 160 109 0.54 0.29 11.5 57.0 9,350 Inferred Avino 55 5,790,000 155 81 0.57 0.58 15.1 105.8 33,550 Inferred San Gonzalo 125 540,000 403 314 1.58 0.00 5.5 27.5 Inferred Oxide Tailings 50 1,810,000 113 88 0.44 0.00 5.1 25.6 Total Inferred All Deposits 8,140,000 162 98 0.61 0.41 25.6 158.9 33,550
The effective dates for the resource estimates are August 31, 2016. Mineral Resources are reported at cut-off grades 55, 125 and 50 g/t silver equivalent grade for the Avino, San Gonzalo and oxide tailings respectively as indicated in the table. Silver equivalent cut-off grades were applied to satisfy the condition of reasonable prospects for eventual economic extraction and were calculated using conversion formulas AgEQ = Ag + 55.9 * Au + 72.99 * Cu for Avino Vein, AgEQ = Ag + 69.37 * Au for oxide tailings and AgEQ = Ag + 56.38 * Au for San Gonzalo vein System. Cut-off grades were calculated using current costs, silver price of US$19.50/oz, gold price of US$1,250/oz and copper price of US$2.10/lb. The mineral resource estimates were prepared by Michael O’Brien P.Geo., Pr.Sci.Nat an employee of QG Australia Pty Ltd (an ARANZ Geo Company) , who is independent of the Company, as defined by Section 1.5 of NI 43-101.
33
Open along strike Open along strike
35
34
San Gonzalo Bulk Sample
development of San Gonzalo and mill to support a 250 TPD
agreement on the Avino Mine mineral concessions
production at San Gonzalo Q4 2012
through two financings
the Avino Mine
Mines Ltd.
shelf financing through Cantor Fitzgerald
and completed 1,000 TPD mill expansion
interest in the Avino property
Geophysics, 1,500 soil samples, satellite imagery
numerous veins and prospective surface showings identified
resource estimate on San Gonzalo vein
to accommodate 250 TPD San Gonzalo operation
development at San Gonzalo
for mining equipment
during first quarter of San Gonzalo Production
Mine
estimates on the San Gonzalo and Avino Mines.
250 TPD
to bring plant to 1,500 TPD.
new material from the Avino Mine
meters of drilling at the Bralorne Mine
construction of a tailings storage facility upgrade at the Bralorne Mine
term facility with Samsung for the sale of Avino Mine concentrate
commercial production at the Avino Mine
36
Cat 420F Loader Cat R1600G Scoop Cat 320 D Rock Breaker Cat UG20K Grader Cat 980H Loader Oldenberg Cannon Jumbo
37
Sandvik 2.5 yd scoops Cat 966M Loader
38
Cash cost per ounce and all-in sustaining cash cost per ounce are measures developed by mining companies in an effort to provide a comparable standard. However, there can be no assurance that our reporting of these non-IFRS measures is similar to that reported by other mining companies. Total cash cost per ounce and all-in sustaining cash cost per ounce are measures used by the Company to manage and evaluate operating performance of the Company’s mining operations, and are widely reported in the silver and gold mining industry as benchmarks for performance, but do not have standardized meanings prescribed by IFRS, and are disclosed in addition to IFRS measures. Management of the Company believes that the Company’s ability to control the cash cost per silver equivalent ounce is one of its key performance drivers impacting both the Company’s financial condition and results of operations. Achieving a low silver equivalent production cost base allows the Company to remain profitable even during times of low commodity prices, and provides more flexibility in responding to changing market conditions. In addition, a profitable operation results in the generation of positive cash flows, which then improves the Company’s financial condition. The Company has adopted the reporting of “all-in sustaining cash cost per silver equivalent ounce”. This measure has no standardized meaning throughout the industry. However, it is intended to provide additional information. Avino presents all-in sustaining cash cost because it believes that it more fully defines the total current cost associated with producing a silver equivalent
ability to generate cash flow from operations. Although the measure seeks to reflect the full cost per silver equivalent ounce of production from current operations, it does not include capital expenditures attributable to mine expansions, exploration and evaluation costs attributable to growth projects, income tax payments, and financing costs. In addition, the calculation of all-in sustaining cash costs does not include depreciation and depletion expense as it does not reflect the impact of expenditures incurred in prior periods. The Company’s calculation of all-in sustaining cash costs includes sustaining capital expenditures of $nil as substantially all of the mining equipment used at San Gonzalo and at the Avino stockpiles has been newly purchased or
figures may not add up due to rounding
Metal Production is expressed in terms of silver equivalent ounces, (oz Ag Eq.), the formula for which depends on the gold and silver metal prices used in each year and hence are only indicative. Silver equivalent ounces sold consists of the number of ounces of silver sold plus the number of ounces of gold sold multiplied by the ratio of the average spot gold price to the average spot silver price for the corresponding period. Metals Prices used to calculate Ag Eq. are as follows: 2012 ($1700Au, $34ag), 2013 ($1300Au, $20ag), 2014 ($1300Au, $20Ag), 2015 ($1150Au, $16Ag, $3 Cu) 2016 ($1180Au, $14.84Ag, $2.12Cu)
Cash in U.S. dollars at March 31, 2016 has been translated at the spot rates for USD-MXP and USD-CAD on that date. Cash cost per ounce, all in sustaining cash cost per ounce, and capital expenditures have been translated at average rates of USD-CAD currency exchange for the periods presented
39
(Partners, Affiliates & Suppliers)
40