Percent of Presentations Rated 2 (Meets Minimum Standard) or Above - - PDF document

percent of presentations rated 2 meets minimum standard
SMART_READER_LITE
LIVE PREVIEW

Percent of Presentations Rated 2 (Meets Minimum Standard) or Above - - PDF document

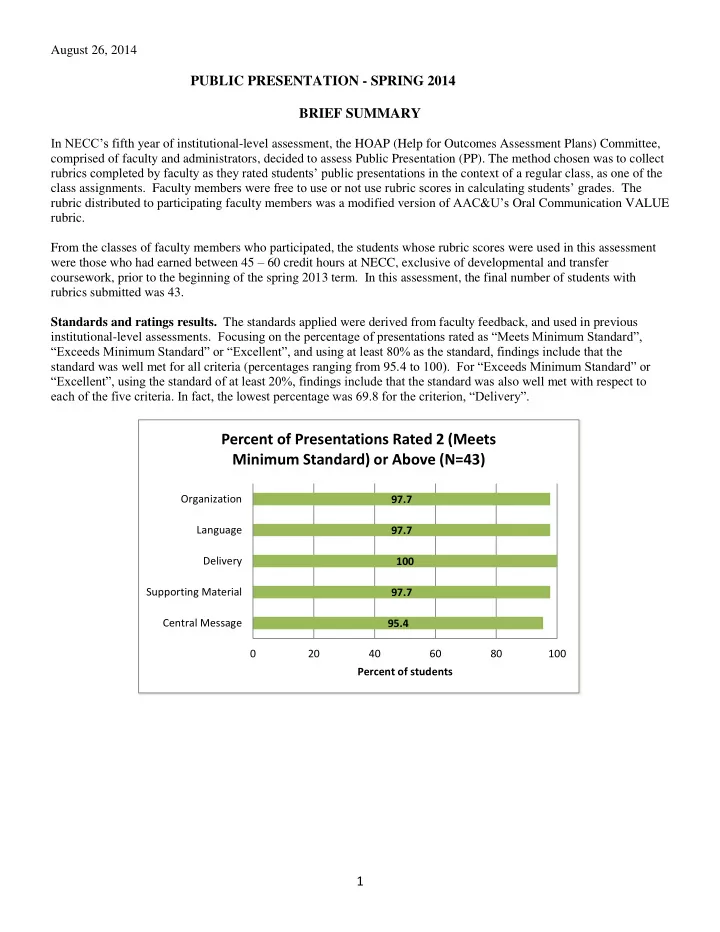
August 26, 2014 PUBLIC PRESENTATION - SPRING 2014 BRIEF SUMMARY In NECCs fifth year of institutional-level assessment, the HOAP (Help for Outcomes Assessment Plans) Committee, comprised of faculty and administrators, decided to assess Public


slide-1
SLIDE 1

1

August 26, 2014

PUBLIC PRESENTATION - SPRING 2014 BRIEF SUMMARY

In NECC’s fifth year of institutional-level assessment, the HOAP (Help for Outcomes Assessment Plans) Committee, comprised of faculty and administrators, decided to assess Public Presentation (PP). The method chosen was to collect rubrics completed by faculty as they rated students’ public presentations in the context of a regular class, as one of the class assignments. Faculty members were free to use or not use rubric scores in calculating students’ grades. The rubric distributed to participating faculty members was a modified version of AAC&U’s Oral Communication VALUE rubric. From the classes of faculty members who participated, the students whose rubric scores were used in this assessment were those who had earned between 45 – 60 credit hours at NECC, exclusive of developmental and transfer coursework, prior to the beginning of the spring 2013 term. In this assessment, the final number of students with rubrics submitted was 43. Standards and ratings results. The standards applied were derived from faculty feedback, and used in previous institutional-level assessments. Focusing on the percentage of presentations rated as “Meets Minimum Standard”, “Exceeds Minimum Standard” or “Excellent”, and using at least 80% as the standard, findings include that the standard was well met for all criteria (percentages ranging from 95.4 to 100). For “Exceeds Minimum Standard” or “Excellent”, using the standard of at least 20%, findings include that the standard was also well met with respect to each of the five criteria. In fact, the lowest percentage was 69.8 for the criterion, “Delivery”.

95.4 97.7 100 97.7 97.7 20 40 60 80 100 Central Message Supporting Material Delivery Language Organization Percent of students

Percent of Presentations Rated 2 (Meets Minimum Standard) or Above (N=43)

slide-2
SLIDE 2

2

  • Limitations. Faculty participation was very limited, resulting in a low number of rubric submissions, and a final

extremely small student sample size, as indicated in the table below: Number of… Classes identified as having students who met the criteria 530 Faculty associated with those classes 243 Classes per instructor Ranged from 1 to 8 Duplicated students who met the criteria in those classes 1525 Unduplicated students who met the criteria in those classes 491 Faculty indicating they would participate 30 Number of faculty actually participating 20 Classes associated with the participating faculty 29 Rubrics of targeted students actually collected 46 Unduplicated students’ rubrics for final analyses 43 In this assessment:  Just 20, or 8.2% of the 243 instructors initially identified participated.  Just 29, or 5.5% of the 530 classes identified were represented.  Just 43, or 8.8% of the 491 unduplicated students identified were represented in the final sample. Summary and recommendations. Overall summary points include that:  Extensive faculty non-participation severely limits the ability to generalize across all students.  Because of the low number of students represented by the rubrics collected, it is highly unlikely that the students whose presentations were rated are representative of the NECC students identified for this project. Therefore, it is not possible with any level of confidence to draw any institutional-level conclusions concerning students’ Public Presentation skills.  Going by the rubrics analyzed, the weakest area for students is “Delivery”. Recommendations going forward include to:  Publicize these assessment results, giving particular attention to the area of “Delivery”. Even though the sample is small, it is likely that students in general could benefit from working on this aspect of Public

  • Presentation. Also, by drawing attention to the rubric, skills defined by the criteria may also be improved.

 Importantly, efforts to more effectively engage faculty in the institutional assessment efforts must be

  • developed. Increased faculty participation leads to increases in the number of students represented in the

artifacts collected, and then increased confidence in any conclusions drawn from the data.

81.4 86.1 69.8 79 81.4 20 40 60 80 100 Central Message Supporting Material Delivery Language Organization Percent of students

Percent of Students Rated 3 (Exceeds Minimum Standard) or Above (N=43)

slide-3
SLIDE 3

3

FULL REPORT: YEAR V INSTITUTIONAL LEVEL ASSESSSMENT: PUBLIC PRESENTATION - SPRING 2014 Background Development of core academic skills for assessment. During 2008, a committee of faculty and administrators reviewed the three existing college-wide associate degree competencies, with the goal to revise and update them as

  • necessary. This work resulted in the identification of core academic skills that students were expected to develop in

the course of their studies. In their current version, these skills are:  Global Awareness  Information Literacy  Public Presentation  Quantitative Reasoning  Science and Technology  Written Communication Each academic year, one or more of these skills are assessed at the institutional level, beginning in 2009-10 with the assessment of Written Communication skills. Following is a description of the Year V assessment, which focused on Public Presentation. Method Development of method. Over the 2013-14 AY, in addition to informal exchanges, The HOAP (Help for Outcomes Assessment Plans) Committee, comprised of faculty and administrators, met to help plan and implement the process.  One of the first tasks was to decide how to obtain student work to evaluate. Practical considerations flowing from the nature of the skill, being Public Presentation, dictated that students would need to be rated in the context of their regular classes, by the class instructors. A timeline for notifying instructors of our plan was developed, starting with a general notification and ending with notifications to just those instructors with targeted students.  Next was to consider how the collected products would be evaluated. To support comparability of ratings across classes, we decided to use a common rubric, with standards for evaluation defined clearly enough as to support uniform interpretations. The rubric selected was a modified version of AAC&U’s Oral Communication VALUE rubric, a version already in use on campus in association with the Core Academic Skills intensive course initiative (see Appendix 1).  Our criterion for inclusion of students in the product collection efforts was that they would have earned between 45-60 credit hours at NECC prior to the beginning of the spring term, exclusive of any transfer and developmental credit hours. In late February 2014, after the registration “freeze” date, a list was obtained of all students who met the credit hours criterion for assessment. Students identified were organized by classes in which they were enrolled, with some students being enrolled in more than one of the classes.  The process of faculty notification included the following:

  • To enable faculty to plan ahead with respect to Public Presentation assignments, in December 2013, all

faculty (full-time, half-time, and DCE) were sent an email to generally inform them about the work being planned for the spring term. The rubric to be used was attached (see Appendix 2).

  • In January 2014, all faculty were sent an email with more details about the process and again with the

rubric attached (see Appendix 3).

slide-4
SLIDE 4

4

  • In early March 2014, faculty who had at least one of the identified students in their class or classes were

sent individualized emails asking them to let us know in which of the classes named, if any, a Public Presentation assignment was being given, and whether they were willing to participate in this institutional assessment (see Appendix 4). The number of classes detailed per instructor ranged from 1 to 8.

  • In late March 2014, an individualized email was sent to faculty members who had agreed to participate

(see Appendix 5).

  • In addition to the above notifications, there were many other less formal email and personal contacts to

remind faculty and to encourage participation. Rubric collection. Collection efforts included meeting faculty to retrieve and copy the completed rubrics for their classes, or receiving already copied rubrics. Faculty were not informed as to the identity of the targeted students. After collection, the rubrics for these students were pulled from the class sets, with the remaining rubrics shredded. Preparation of rubrics for rating. All rubrics collected were logged in and assigned a unique identifier. All identifying information related to students, faculty, and classes was then removed. Data decisions. For the analyses, each student was represented by one rubric. Three students each had two rubrics submitted, one from each of two different classes. In these cases, the one product selected was that which had the

  • verall highest ratings total, the rationale being that if the student could produce at that level once, they likely have that

level of ability. Results Rubric collection. The overall summary of rubric collection is represented as follows: Number of… Classes identified as having students who met the criteria 530 Faculty associated with those classes 243 Classes per instructor Ranged from 1 to 8 Duplicated students who met the criteria in those classes 1525 Unduplicated students who met the criteria in those classes 491 Faculty indicating they would participate 30 Number of faculty actually participating 20 Classes associated with the participating faculty 29 Rubrics of targeted students actually collected 46 Unduplicated students’ rubrics for final analyses 43 Ratings results. The rubric used had 4 rating categories, with “0” and “1” designated as “Does not meet minimum standards”; “2” as “Meets minimum standards”; “3” as “Exceeds minimum standards”; and “4” as “Excellent”. Charts 1-5 below show the percent of presentations receiving rubric ratings in each of the four rating categories for each criterion. The percent of presentations rated as “Meets Minimum Standard” or above and “Exceeds Minimum Standard” or above accompanies each table.

slide-5
SLIDE 5

5 CHARTS 1-5: BY CRITERION, PRESENTATIONS’ RATINGS PERCENTAGES

Percent rated 2 (Meets Minimum Standard) or above: 97.7 Percent rated 3 (Exceeds Minimum Standard) or above: 81.4 Percent rated 2 (Meets Minimum Standard) or above: 97.7 Percent rated 3 (Exceeds Minimum Standard) or above: 79

2.3 16.3 39.5 41.9 20 40 60 80 100 1, 1.5 (Does Not Meet Minimum Standard 2, 2.5 (Meets Minimum Standard) 3, 3.5 (Exceeds Minimum Standard) 4 (Excellent) Percent of students

Chart 1: Organization (N=43)

2.3 18.7 39.5 39.5 20 40 60 80 100 1, 1.5 (Does Not Meet Minimum Standard) 2, 2.5 (Meets Minimum Standard) 3, 3.5 (Exceeds Minimum Standard) 4 (Excellent) Percent of students

Chart 2: Language (N=43)

slide-6
SLIDE 6

6

Percent rated 2 (Meets Minimum Standard) or above: 100 Percent rated 3 (Exceeds Minimum Standard) or above: 69.8 Percent rated 2 (Meets Minimum Standard) or above: 97.7 Percent rated 3 (Exceeds Minimum Standard) or above: 86.1

30.2 27.9 41.9 20 40 60 80 100 1, 1.5 (Does Not Meet Minimum Standard) 2, 2.5 (Meets Minimum Standard) 3, 3.5 (Exceeds Minimum Standard) 4 (Excellent) Percent of students

Chart 3: Delivery (N=43)

2.3 11.6 44.2 41.9 20 40 60 80 100 1, 1.5 (Does Not Meet Minimum Standard) 2, 2.5 (Meets Minimum Standard) 3, 3.5 (Exceeds Minimum Standard) 4 (Excellent) Percent of students

Chart 4: Supporting Material (N=43)

slide-7
SLIDE 7

7

Percent rated 2 (Meets Minimum Standard) or above: 95.4 Percent rated 3 (Exceeds Minimum Standard) or above: 81.4

Charts 6 and 7 show, respectively, for each criterion, the percentage of presentations rated as “Meets Minimum Standard” and above and “Exceeds Minimum Standard” and above.

4.6 14 44.2 37.2 20 40 60 80 100 1, 1.5 (Does Not Meet Minimum Standard) 2, 2.5 (Meets Minimum Standard) 3, 3.5 (Exceeds Minimum Standard) 4 (Excellent) Percent of students

Chart 5: Central Message

95.4 97.7 100 97.7 97.7 20 40 60 80 100 Central Message Supporting Material Delivery Language Organization Percent of students

Chart 6: Percent of Presentations Rated 2 (Meets Minimum Standard) or Above (N=43)

slide-8
SLIDE 8

8

  • Standards. For this assessment of Public Presentation, we applied the same faculty-derived standards used for the

Writing Skills and Information Literacy assessments. That is, the standard would be at least 80% for the percentages

  • f presentations scored in the “Meets Minimum Standard”, “Exceeds Minimum Standard” and “Excellent” categories

combined, and at least 20% for the percentages of presentations scored in the “Exceeds Minimum Standard” or “Excellent” categories. Standards and ratings results. Focusing on the percentage of presentations rated as “Meets Minimum Standard”, “Exceeds Minimum Standard” or “Excellent”, and using at least 80% as the standard, findings include that the standard was well met for all criteria (percentages ranging from 95.4 to 100). For “Exceeds Minimum Standard” or “Excellent”, and using the standard of at least 20%, findings include that the standard was exceedingly well met with respect to each of the five criteria. In fact, the lowest percentage was 69.8 for the criterion, “Delivery”. Feedback from faculty participants. Participating faculty were asked:  How easy or difficult was it for you to participate in this assessment?  Did participating provide any benefit to you in your work with the students in your classes? Most of the faculty responding reported that participating in this assessment was relatively easy. Most also indicated that participation provided some benefit. Sample comments include:  The main benefit to me was that it forced me (in a good way) to slow down a bit, review/examine my students' projects extra carefully, and think more about what grade I was assigning them.  …it did help me consider/re-evaluate the criteria on which I was evaluating the student assignment!  It helped me to break down the different presentation components which I found to be helpful.  I felt that participating helped me to think through my assignments and gauge whether they were assessing what I really wanted to be assessing.  It really helped shape my grading and I have added pieces of it to my future grading sheets

Overall Discussion and Summary

All four institutional-level assessments have depended on faculty volunteering to participate, either by submitting student work or giving class time. In situations where products are to be submitted, a certain amount of participation is precluded when there are no class assignments planned that relate to the skill(s) being assessed. In attempts to address this, faculty are alerted in advance of the term in which the institutional assessment is planned, so that they would have an opportunity to craft relevant assignments.

81.4 86.1 69.8 79 81.4 20 40 60 80 100 Central Message Supporting Material Delivery Language Organization Percent of students

Chart 7: Percent of Students Rated 3 (Exceeds Minimum Standard) or Above (N=43)

slide-9
SLIDE 9

9

In this assessment:  Just 20, or 8.2% of the 243 instructors initially identified participated.  Just 29, or 5.5% of the 530 classes identified were represented.  Just 43, or 8.8% of the 491 unduplicated students identified were represented in the final sample. Because of extensive faculty non-participation, just 8.8% of the unduplicated identified students were included in the final sample. Therefore, it is highly unlikely that the students whose rubric ratings were analyzed are representative of the NECC students identified for this project. Therefore, it is not possible with any level of confidence to draw any institutional-level conclusions concerning students’ Public Presentation skills. Even though the findings from this assessment are not directly usable in terms of estimating the Public Presentation skill levels of NECC students, the work has value if it stimulates discussion, reflection, and increased assessment and rubric-related professional development opportunities for faculty. Each of the core skills now has a developed rubric to be used to guide assignment development, classroom instruction, and assessment. Increased efforts in those directions may eventually produce higher product yields for institutional assessment, but more importantly, result in a richer educational experience for students vis-a-vis the core skills - skills that as an institution, NECC has concluded are central learning outcomes for degree seeking students. The method used involved having faculty assess their own students as they gave their in-class presentations. We recognized the possibility for bias or inflated ratings, especially considering that these instructors know that their class ratings would be part of the institutional assessment report. To minimize bias in terms of the particular students who qualified for this study, and whose rubrics would be included for analysis, the instructors were not informed as to the targeted students' identities. We had discussed other procedures such as having an additional faculty member attend the classes where presentations would be given, and acting as a second rater. For a number of reasons, we decide that this was not feasible.  First, we would have had to have a cadre of faculty available to go to these classes – classes which are held at various times - days and evenings - throughout the week, and which in many cases might have been held at the same times or been overlapping.  Second, when class presentations are required, they typically extend over multiple class periods to accommodate all of the students. Our second raters would have had to be available, then, multiple times for each class.  Third, the presence of a second rater who was unfamiliar to the students may have caused distraction and possible unease at a time when many students are already anxious at the prospect of delivering a class

  • presentation. There may, then, have been an effect on their performance.

In the end, we decided that we would simply have instructors rate their own students, using the prescribed rubric containing what we believe to be clear rating categories and standards. In this way, we sought to assure uniformity of interpretation and judgments of performance. Considering the above, it is instructive to note that even within the context of generally high performance ratings, a hierarchy of skills competence emerged. That is, while students were rated highly across the board, the criterion of “Delivery” emerged as the one with the lowest percentage of students – 69.8% - rated as “Exceeds Minimum Standards” or above. On the rubric, “Delivery” was defined as “May include: Posture, gesture, eye contact, expressiveness”. Explanations accompanying the rating categories refer to terms such as delivery technique and the level of comfort exhibited. These assessment results, then, point to an area where more work with students is indicated. When instructors discuss class presentation assignments with their students, it may be useful to share this data and include hints or suggestions to improve delivery. Towards that goal, the Coordinator of Theater was asked for suggestions on what faculty can do to help students improve with respect to “Delivery”. What can faculty do to help students at least appear comfortable and confident? In response, the following was offered:

slide-10
SLIDE 10

10

I have ten items I evaluate for delivery, though some can be combined: Rate, Volume, Pitch, Variety, (which is varying the first three), Enunciation, Pronunciation, Gesture, Posture, Eye Contact, and Enthusiasm. There are several factors that contribute to a student's discomfort. A lack of confidence can be lessened with positive thinking. … (We) use exercises and ice breakers to help deal with this. Students who are unprepared are far more likely to appear nervous, as well they should. Preparation includes organization of the material, creating notes (I prefer cue cards) which include a written out introduction and conclusion, key words in outline form and quotations and statistics and REHEARSAL. I do not allow the students to read their speeches. Even the written out

  • intro. and conclusion should be well enough rehearsed to allow for eye contact. I also do not allow students to

memorize because this contributes to nervousness and can be stilted or forgotten. The same questions were posed to the Public Presentation coach, who offered the following:

slide-11
SLIDE 11

11 APPENDICES

slide-12
SLIDE 12

12

January 2014

Appendix 1: NECC PUBLIC PRESENTATION RUBRIC Student name: ____________________________________________ Additional comments or notes: ________________________________________________________ ________________________________________________________ ____________________________________________________________________ ____________________________________________

Criteria Excellent 4 Exceeds Minimum Standard 3 Meets Minimum Standard 2 Does Not Meet Minimum Standard 1 - 0 Ratings Mandatory

  • 1. Organization

Presentation includes introduction, conclusion, sequenced material within the body, and transitions Organizational pattern is clearly and consistently observable and skillful: Makes presentation cohesive. Organizational pattern is clearly and consistently

  • bservable.

Organizational pattern is intermittently

  • bservable.

Organizational pattern is not apparent.

  • 2. Language

Presenter’s language choices support effectiveness of presentation and are appropriate to audience Language is imaginative, memorable, compelling, effective, and appropriate. Language is thoughtful, appropriate and generally supports effectiveness of presentation. Language is mundane, commonplace, and appropriate: Partially contributes to effectiveness of presentation. Language is unclear, not appropriate to audience, and minimally supports effectiveness of presentation.

  • 3. Delivery

May include: Posture, gesture, eye contact, expressiveness Delivery techniques make the presentation

  • compelling. The

presenter appears polished and confident. Delivery techniques make the presentation

  • interesting. The

presenter appears comfortable. Delivery techniques make the presentation understandable, but the presenter appears tentative. Delivery techniques detract from the understandability of the presentation: Presenter appears uncomfortable.

  • 4. Supporting Material

Examples, illustrations, statistics, analogies, and/

  • r quotations are used to

establish credibility of presenter Supporting materials make appropriate reference to information or analysis to significantly support the presentation or establish presenter’s authority. Supporting materials make appropriate reference to information or analysis to generally support the presentation or establish presenter’s authority. Supporting materials make appropriate reference to information or analysis to partially support the presentation or establish presenter’s authority. Insufficient supporting materials minimally support the presentation or establish presenter’s authority.

  • 5. Central Message

A theme or point is established by presenter and reinforced by supporting material. Central message is compelling: Precisely stated, appropriately repeated, memorable, and strongly supported. Central message is clear and consistent with the supporting material. Central message is basically understandable but is not often repeated and not memorable. Central message can be deduced but is not explicitly stated in the presentation. Optional

  • 6. Additional Criteria

Example: Time minimum/ maximum

  • 7. Additional Criteria

Example: Visual aids, PowerPoint, etc.

slide-13
SLIDE 13

13 Appendix 2 December 2013 To: All NECC Faculty Members From: Help for Outcome Assessment Plans Committee (HOAP) (Judi Ciampi, Nancy Garcia, Kerin Hamidiani, Rick Lizotte, Gail Stuart, Suzanne Van Wert, Ellen Wentland) Re: Early notice – Spring 2014 Institutional Assessment of Public Presentation For this spring’s institutional assessment of the core academic skill of Public Presentation (formerly known as Oral Communication), we need your help! We rely on faculty members to support institutional learning outcomes assessment – a process required by NEASC. In the past, we have asked faculty members to submit student products prepared in response to class assignments. This spring, because of the nature of the skill we plan to assess, we will be asking faculty members in classes where students are doing presentations to rate their students using a rubric we have developed for this purpose. A copy of this rubric is attached. At this time, we would like to encourage you to include Public Presentation in your spring class assignments – regardless of discipline. As a guide to what we will be assessing in student work, we ask that you consider asking students to do any or all of the following in one or more

  • f their class presentation assignments:
  • 1. Conduct an audience analysis and customize a presentation with a clear message and

appropriate language that will meet audience needs.

  • 2. Compose and deliver a presentation with an effective introduction, appropriate support

and conclusion.

  • 3. Deliver a presentation confidently, with appropriate posture, expressiveness, pace,

gestures and demeanor.

  • 4. Use visual aids as part of a presentation, including appropriate technologies.

We are sending this early notice so that if you don’t already have Public Presentation assignments in your syllabi, you hope that will consider including them in the spring. If you are willing to participate, but need some help, contact us! Early in the spring term, we will be following up with more information. Thank you!

slide-14
SLIDE 14

14 Appendix 3

January 2014 Announcement to Faculty - Spring 2014 Assessment of Public Presentation Dear Colleagues, As you know, NECC assesses our institutional-level core academic skills on a regular basis. Thanks to many of you, we have been able to assess Written Communication, Global Awareness, Quantitative Reasoning, and Information Literacy. The results of those assessments may be viewed at: http://facstaff.necc.mass.edu/faculty-resources/program-review-outcomes-assessment/institutional/ On December 16, we emailed you information about our institutional assessment plan for this spring, which is to assess students’ Public Presentation (formerly Oral Communication) skills. Because of the nature of the skill we plan to assess, we will be asking faculty members in classes where students are doing presentations to rate their students using a rubric we have developed for this purpose. A copy

  • f this rubric - somewhat modified from the version we sent in December - is attached.

If you have not already included a Public Presentation assignment in your spring class, please consider doing so. As a guide to this type assignment, consider asking students to do any or all of the following in their class presentations:

  • 1. Conduct an audience analysis and customize a presentation with a clear message and

appropriate language that will meet audience needs.

  • 2. Compose and deliver a presentation with an effective introduction, appropriate support and

conclusion.

  • 3. Deliver a presentation confidently, with appropriate posture, expressiveness, pace, gestures and

demeanor.

  • 4. Use visual aids as part of a presentation, including appropriate technologies.

Feel free not only to use the attached rubric to evaluate students’ presentations, but to distribute to students to guide their work. Later in the term, we will contact you with more information about your participation. Our plan is to collect completed rubrics, remove identifying information (student, instructor, and class), and then combine data across students. Reported data will be in the aggregate only. If you are willing to participate, but need some help, contact us! Thank you! Suzanne Van Wert and Ellen Wentland: Co-Chairs: Institutional-Level Outcomes Assessment Judi Ciampi, Nancy Garcia, Kerin Hamidiani, Rick Lizotte, Gail Stuart, Suzanne Van Wert, and Ellen Wentland: Help for Outcome Assessment Plans Committee (HOAP) Members

slide-15
SLIDE 15

15 Appendix 4

Early March 2014 Dear Colleague: This spring’s NECC institutional assessment will examine our students’ skills in Public Presentation. This skill asks students to do the following:  Conduct an audience analysis and customize a presentation with a clear message and appropriate language that will meet audience needs.  Compose and deliver a presentation with an effective introduction, appropriate support and conclusion.  Deliver a presentation confidently, using techniques such as posture, expressiveness, pace, gestures and demeanor.  Use visual aids as part of a presentation, including appropriate technologies. For this assessment, we have identified classes which have at least one registered student who has earned from 45-60 credit hours at NECC. One or more of your classes has been identified. If you require students in

  • ne or more of these classes to do a presentation which demonstrates the skills listed above, we hope you

will be willing to help. You will not have to change your curriculum, and no one else will be present in your classroom during the student presentations. We ask only that you evaluate your students’ performance with a rubric that we have developed for this purpose, a copy of which is attached. Please feel free to add any additional criteria and to distribute this rubric to your students. Following the student presentations, we will ask for copies of the completed rubrics so that we may compile the results across the college. We will be glad to make the copies, if you prefer. All student, instructor, and class identifying information will be removed from the rubrics. The results will then be summarized for the

  • verall purpose of evaluating in the aggregate NECC students’ Public Presentation Skills.

Below you will find a table listing the class(es) we have identified. Please hit “Reply” and then go to the table and indicate with a “Yes” or “No” whether you have a Public Presentation assignment for your students that you are willing to evaluate using the attached rubric. Then simply send the email back to

  • us. We ask that you please reply by Wednesday, March 26th..

Instructor CRN – Subj Code – Course # - Sect # - Course Name Public Presentation- Yes or No Date completed rubrics will be ready for pick-up/ copying

For all classes where you say “Yes”, we will get back to you with more specific instructions. If you have any questions, please contact Suzanne Van Wert (978-556-3392) or Ellen Wentland (978-556-3969)

  • r email us at svanwert@necc.mass.edu or ewentland@necc.mass.edu.

Thank you very much for your cooperation and support of this project! Suzanne Van Wert Ellen Wentland Co-Chairs
Institutional-Level Outcomes Assessment

slide-16
SLIDE 16

16 Appendix 5 Late March 2014 Dear Colleague, Thank you for agreeing to participate in this year’s institutional assessment of Public Presentation. For this particular assessment, we would like to collect your evaluation of your students’ classroom presentations. The presentations may be done at any time before the end of final exam week. In order to compile data across the college, we need the evaluation criteria to be somewhat consistent for all classes. Therefore, we are asking that you evaluate your students’ performance using the attached NECC Public Presentation rubric. Please note that the rubric may be easily expanded to include additional criteria that are specific to your own class assignment. We will be happy to work with you to design a rubric that reflects your own evaluation criteria, along with our institutional outcomes. You do not have to include the institutional criteria as part of the student’s grade, but we are asking that you assess all of the criteria. Following your students’ presentations, we will ask for copies of your completed rubrics so that we may compile the results across the college. We can assist you with copying if you would like. Please do not remove student names from the rubrics. We will remove all student, instructor, and class identifying information from the rubrics once we have separated out the evaluations

  • f targeted students (those who have completed between 45-60 credits). The results will then

be summarized for the overall purpose of evaluating in the aggregate NECC students’ Public Presentation Skills. If you would like to increase your familiarity with the institutional rubric, we may schedule some sessions for participating faculty to practice using the rubric. These sessions would likely be held in the late afternoon during the next few weeks, but they are subject to demand, so if we don’t hear from you, we will assume you are not interested. Please don’t hesitate to contact us with any questions you may have. Once again, thank you for your willingness to support institutional assessment.