
SLIDE 1
1
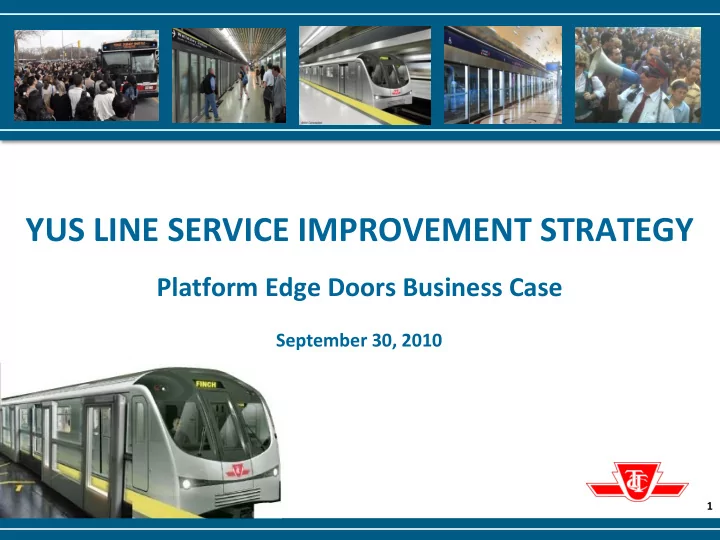
YUS LINE SERVICE IMPROVEMENT STRATEGY
Platform Edge Doors Business Case
September 30, 2010
YUS LINE SERVICE IMPROVEMENT STRATEGY Platform Edge Doors Business - - PowerPoint PPT Presentation
YUS LINE SERVICE IMPROVEMENT STRATEGY Platform Edge Doors Business Case September 30, 2010 1 Presentation Outline Introduction Service Improvement Strategy Platform Edge Doors (PEDs) Business Case Reliability/Capacity
1
September 30, 2010
2
3
4
National Post, March 30, 2010
5
6
Industry Best Practices
level of reliability through automation alone
to reduce total incidents by 75% to achieve the target reliability level of 1 peak failure per week
and then evaluate every aspect of the subway in terms of reliability
* Presented by NOVA at the June 2, 2010 Commission Meeting
7
0.0 0.1 0.2 0.3 0.4 0.5 0.6 To
7
Million Car Kilometres Between Incidents Causing a Delay > 5 Minutes to Service (2008)
TTC
Top 7 metros: Asia, South America
Key Areas for Improvement:
Control
Toronto #5 for Europe + North America
8
9
10
Stakeholders Impacts Public Safety Improved Reliability Reduction in Noise Air quality TTC Operation & Maintenance Staff stress and trauma Perception of the TTC network Capital costs / Residual value
11
12
13
14
Values in 2010 CAD Discount rate at 8%
Economic Benefits M$ 567.1 Investments M$
Economic Net Present Value M$ 55.5 Notes:
due to the high passenger volume on the YUS, it provided the greatest return.
Treasury Board.
15
16
17
18
– Managing scope creep – Identifying and managing interfaces – Tight controls on PED Supplier – Involving Operations Departments early in design and implementation process – Developing a prototype installation
19
20
21
0.0 0.1 0.2 0.3 0.4 0.5 0.6 To
Million Car Kilometres Between Incidents Causing a Delay > 5 Minutes to Service (2008)
Toronto #5 for Europe + North America
1.0 4 1.5 1.6
TTC
Top 7 metros: Asia, South America Key Areas for Improvement:
22
23
24
25