
SLIDE 1
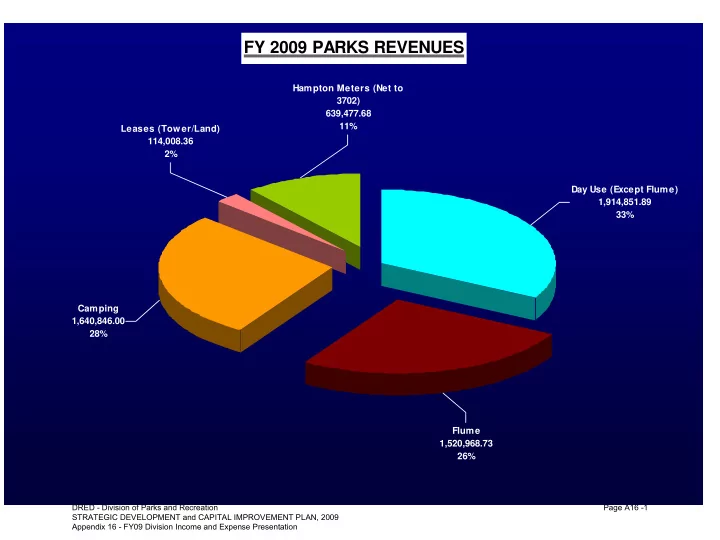
FY 2009 PARKS REVENUES
Hampton Meters (Net to 3702) 639,477.68 11% Leases (Tower/Land) 114,008.36 2% Camping 1,640,846.00 28% Flume 1,520,968.73 26% Day Use (Except Flume) 1,914,851.89 33%
DRED - Division of Parks and Recreation STRATEGIC DEVELOPMENT and CAPITAL IMPROVEMENT PLAN, 2009 Appendix 16 - FY09 Division Income and Expense Presentation Page A16 -1