Goddard Space Flight Center E.R. Christian, G.A. de Nolfo, T.T. von - - PowerPoint PPT Presentation

goddard space flight center
SMART_READER_LITE
LIVE PREVIEW

Goddard Space Flight Center E.R. Christian, G.A. de Nolfo, T.T. von - - PowerPoint PPT Presentation

Elemental Composition Measurements W.R. Binns, M.H. Israel Washington University M.E. Wiedenbeck Jet Propulsion Laboratory A.C. Cummings, R.A. Leske, R.A. Mewaldt, E.C. Stone Caltech Goddard Space Flight Center E.R. Christian, G.A. de Nolfo,


slide-1
SLIDE 1

Elemental Composition Measurements

W.R. Binns, M.H. Israel Washington University M.E. Wiedenbeck Jet Propulsion Laboratory A.C. Cummings, R.A. Leske, R.A. Mewaldt, E.C. Stone Caltech E.R. Christian, G.A. de Nolfo, T.T. von Rosenvinge Goddard Space Flight Center

slide-2
SLIDE 2

es multiple dE/dx and total energy method determine charge, mass, and energy

slide-3
SLIDE 3

ACE-CRIS Elements – 18.5 Years of Data

28 29 30 31 32 33 34 35 36 37 38 39 40 41

Charge (Z)

zrms<0.5 theta<45 rng3-8:rpproj 25-5850 rng2: rpproj 25-2550 Ni Cu Zn Ga Ge As Se Br Kr Rb Sr Y Zr

  • Data collected
  • ver period fro

12/4/1997-5/24/

  • Excellent

resolution in charge for UH nuclei

  • Limited statis

the highest Z

slide-4
SLIDE 4

Comparison with SuperTIGER

30 31 32 33 34 35 36 37 38 39 40 41

Charge (Z)

zrms<0.5 theta<45 rng3-8:rpproj 25-5850 rng2: rpproj 25-2550

Zn Ga Ge As Se Br Kr Rb Sr Y Zr

ACE resolution in charge shows complete separation of elements SuperTIGER has greater statistics, with still good resolution Number of nuclei with Z>30. ACE=280; SuperTIGER=1159 The two data sets are very complimentary to each other

slide-5
SLIDE 5

Source Abundances

  • We see that there is generally

agreement, but ACE appears t systematically a bit lower for Z=3 and a bit higher for Z=37-40.

  • The reason for this is not know

xxDifferences in the data sets are

  • ACE measurements are in sp

SuperTIGER measured at b altitudes

  • ACE data at ~150–700 MeV/

SuperTIGER starts at >800 MeV/nuc above the atmosph zzand extends to ~10 GeV/nuc

  • ACE data is averaged over

years of solar modulation. Su TIGER data taken at a speci modulation level (in early 20

30 31 32 33 34 35 36 37 38 39 40

s\8_25_2016_Rng2-8\Final_Corrections\Plots

ACE GCRS SuperTIGER GCRS

Charge (Z)

slide-6
SLIDE 6

GCRS/SS abundances vs mass

  • As we have see

with SuperTIGER refractories and volatiles are mi at high atomic ma when source abundances are taken relative to Solar System abundances (ISM) and there is a l scatter

10 20 30 40 50 60 70 80 90 100 10 20 30 40 50 60 70 80 90 100

Mass (amu) Mass (amu) Refractories Volatiles N Ne S Cu Zn Ga Ge Se Rb Sr Zr Mg Si Ca Fe Co Ni 100% Normal ISM

Meyer Drury & Ellison (1997) proposed that the refractories are over-abundant

slide-7
SLIDE 7

Least chi-squared fit to data

10 20 30 40 50 60 70 0.1 1 10 20 30 40 50 60 70 0.1 1

GCRS/Mix Fraction Mass (amu) Refractories Volatiles N Ne S Mg Si Ca Fe Ni Co Cu Zn Ga Ge GCRS/Mix Fraction Mass (amu) 6% MSM + 94% ISM

mparison of GCR source dances with a mixture % SS and 6% Massive

  • utflow + ejecta

sley & Heger, ApJ ). ring and separation of ctories and volatiles is ly improved. re is an enhancement of ctories over volatiles by ctor of ~3-5 over the full

  • f masses
slide-8
SLIDE 8

0.0 0.1 0.2 0.3 0.4 0.5

Mix fraction Volatiles Refractories Combined Best fit=6+6

  • 2.5 %

0.0 0.1 0.2 0.3 0.4 0.0 0.2 0.4 0.6 0.8 1.0 1.2 1.4 1.6 1.8 2.0 2.2 2.4 2.6 2.8 3.0

\ACE\UH elements & Isotopes\8_25_2016_Rng2-8\Final_Corrections\5.3.2017-Verified_correct_data\Chi-squared_plots5.5.2017

Reduced Chi-squared Mix fraction Volatiles Refractories

Chi-squared Reduced Chi-squared

Best fit corresponds to 6+6

  • 2.5 % massive star material mixed with 94% of normal ISM

This compares with SuperTIGER best fit of 19+11

  • 6% massive star material mixed with 81%

rmal ISM fferences between the two data sets were noted earlier The ACE data are inconsistent with zero massive star material at the 11.4 σ level.

slide-9
SLIDE 9

SuperTIGER data

Best fit is 19% MSM +81% SS

Log-Log plot Semi-log-Log plot with Helium added

slide-10
SLIDE 10

Conclusions

  • The ordering of the element source abundances is substantially

improved if they are taken relative to a mix of massive star material (wind outflow and SN ejecta) plus normal ISM instead

  • f just normal ISM (SS abundances).
  • ACE data show that a mix of 6+6
  • 2.5% massive star material with

~94% of normal ISM gives a best fit to the source abundances. The data are inconsistent with 0% massive star material at the 11.4 σ level.

  • The data show an enhancement of refractory elements over

volatiles by a factor of ~4 as was seen by TIGER & SuperTIGER and a mass dependence of the abundances for both refractory and volatile elements.

  • This is consistent with an origin in associations of massive stars

(OB associations).

slide-11
SLIDE 11

Backups

slide-12
SLIDE 12

Measured and Source Abundance

per panel Error bars included in both measured and source abundances Source data points substantially lower than measured data indicates large secondary component er panel Elements having “Source/1AU” near 1 are mostly “primary” nuclei Ratios larger than 1 result from inaccuracies in nuclear interaction cross-sections and from approximations in models for interstellar propagation and solar modulation used Normalized to Fe=1.0

slide-13
SLIDE 13

ACE data assuming an 20-80% mix

10 20 30 40 50 60 70 0.1 1 10 20 30 40 50 60 70 0.1 1

GCRS/Mix Fraction Mass (amu) GCRS/Mix Fraction Mass (amu) 20% MSM + 80% ISM N Ne S Cu Zn Ga Ge Co Ni Fe Ca Si Mg Refractories Volatiles

Comparison of GCR

  • urce abundances with

ixture of 80% SS nd 20% Massive Star flow + ejecta

  • osley & Heger, ApJ

2007). erestingly the slopes he refractory and atile elements for this 20 mix are nearly the e as they are in the uperTIGER data

slide-14
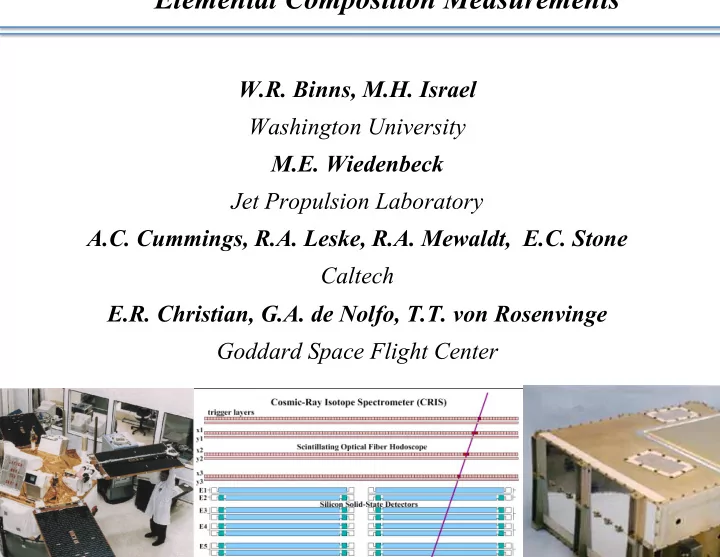
SLIDE 14

Abundances “in-space”

30 31 32 33 34 35 36 37 38 39 40

& Isotopes\8_25_2016_Rng2-8\Final_Corrections\Plots

ACE-In Space SuperTIGER-TOA

Charge (Z)

  • We see that there is gene

good agreement, but ACE appears to be systematica bit lower for Z=30-33 and higher for Z=37-40.

  • The reason for this is not
  • known. Differences in the

data sets are:

  • ACE measurement is in space,

SuperTIGER is measured at bal altitudes

  • ACE measurements are at energ

several hundred MeV/nuc; Supe measures elements with energy MeV/nuc, but most are >1 GeV/nuc

  • ACE data is averaged over 18.5

solar modulation. ST data taken specific solar modulation level.