
SLIDE 1
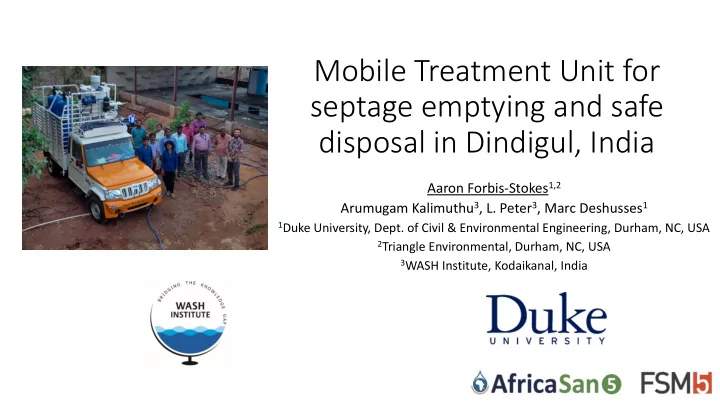
Mobile Treatment Unit for septage emptying and safe disposal in Dindigul, India
Aaron Forbis-Stokes1,2 Arumugam Kalimuthu3, L. Peter3, Marc Deshusses1
1Duke University, Dept. of Civil & Environmental Engineering, Durham, NC, USA 2Triangle Environmental, Durham, NC, USA 3WASH Institute, Kodaikanal, India