
SLIDE 1
Unit 1: Introduction to data
- 1. Data Collection +
Observational studies & experiments
STA 104 - Summer 2017
Duke University, Department of Statistical Science
- Prof. van den Boom
Slides posted at http://www2.stat.duke.edu/courses/Summer17/sta104.001-1/
- 1. Use a sample to make inferences about the population
▶ Ultimate goal: make inferences about populations ▶ Caveat: populations are difficult or impossible to access ▶ Solution: use a sample from that population, and use statistics
from that sample to make inferences about the unknown population parameters
▶ The better (more representative) sample we have, the more
reliable our estimates and more accurate our inferences will be Suppose we want to know how many offspring female lemurs have,
- n average. It’s not feasible to obtain offspring data from on all
female lemurs, so we use data from the Duke Lemur Center. We use the sample mean from these data as an estimate for the unknown population mean. Can you see any limitations to using data from the Duke Lemur Center to make inferences about all lemurs?
1
Sampling is natural ▶ When you taste a spoonful of soup and decide the spoonful
you tasted isn’t salty enough, that’s exploratory analysis
▶ If you generalize and conclude that your entire soup needs salt,
that’s an inference
▶ For your inference to be valid, the spoonful you tasted (the
sample) needs to be representative of the entire pot (the population)
2
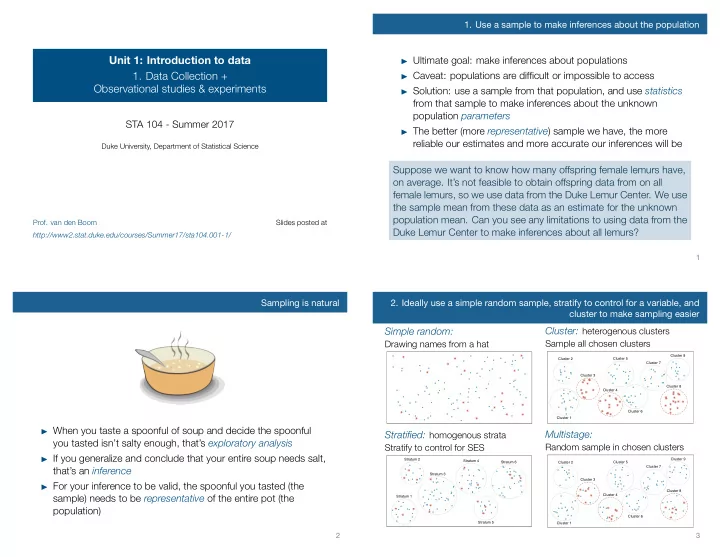
- 2. Ideally use a simple random sample, stratify to control for a variable, and
cluster to make sampling easier
Simple random:
Drawing names from a hat
- Stratified: homogenous strata
Stratify to control for SES
- Stratum 1
Stratum 2 Stratum 3 Stratum 4 Stratum 5 Stratum 6
Cluster: heterogenous clusters
Sample all chosen clusters
- Cluster 1
Cluster 2 Cluster 3 Cluster 4 Cluster 5 Cluster 6 Cluster 7 Cluster 8 Cluster 9
Multistage:
Random sample in chosen clusters
- Cluster 1
Cluster 2 Cluster 3 Cluster 4 Cluster 5 Cluster 6 Cluster 7 Cluster 8 Cluster 9