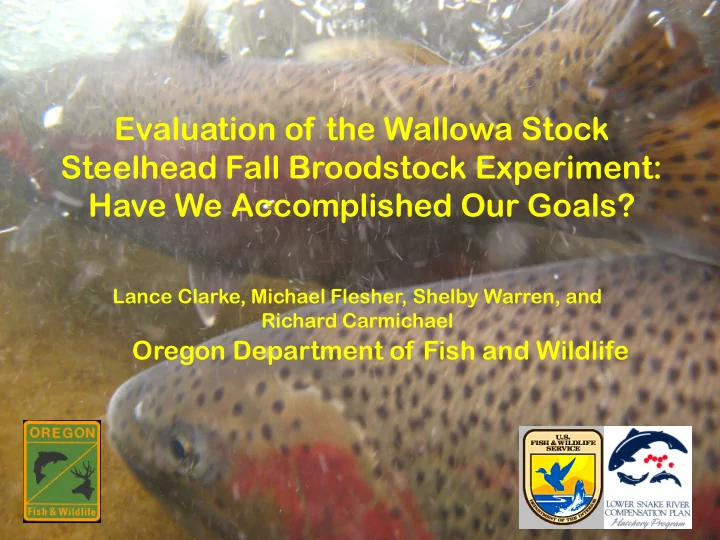
SLIDE 1
Evaluation of the Wallowa Stock Steelhead Fall Broodstock Experiment: Have We Accomplished Our Goals?
Lance Clarke, Michael Flesher, Shelby Warren, and Richard Carmichael
Oregon Department of Fish and Wildlife
SLIDE 2
Wallowa S a Stock Stee eelhea ead
Wallowa Hatchery Joseph La Grande Union Troy
SLIDE 3 Wallowa H a Hatch cher ery y Broodst stock ck
- Stock founded from adults
collected in spring at Ice Harbor (1976) and Little Goose (1977 & 1978) dams
sourced from spring returns to hatchery
Grande Ronde basin from Sept.−April
SLIDE 4 Snake River Hatchery Steelhead Stocks
Lyons Ferry Dworshak B Sawtooth Pahsimeroi Hells Canyon Imnaha Wallowa
Deschutes River basin
SLIDE 5
10 20
Average e Annual al D Desc schutes tes R River er S Straying B By
%
% STRA RAY RA RATE
Snake River Hatchery Steelhead Stocks
HATCHE CHERY P Y PROGRAM
(Based on 11-24 Years of Data)
Error bars = 1 SE
SLIDE 6 Object ectives ves
- Create a new hatchery line from Wallowa stock
returning to Grande Ronde in autumn.
- Autumn Line may stray less and improve the autumn fishery.
- Compare performance of Autumn Line with the
standard Wallowa Stock.
- Is smolt outmigration survival similar?
- Does the Autumn Line return earlier?
- Are smolt-to-adult survival rates similar?
- Does the Autumn Line stray at a lower rate?
- Are contributions to fisheries different?
SLIDE 7
- Upon landing, anglers placed hatchery fish in a tube
– Oriented fish into flow, held up to 24 h – Fish PIT-tagged, transferred to Wallowa Hatchery, held for spawning
Broodsto tock Colle llectio tion a and H Handlin ling
(Brood Years 2004−2007)
SLIDE 8 Oregon Washington Idaho
- Max. Density = 19.5 kg/m3
SLIDE 9 Wallo llowa A Acclim limatio tion P Ponds
- Max. Density = 19.3 kg/m3
SLIDE 10
Juvenile Steelhead Releases
∗ Coded wire tags were implanted into 100K of Autumn Line
and Standard Line juveniles for estimating stray rates.
Brood Year Number PIT tagged Autumn St andard 2004 3,777 3,769 2005 3,567 3,566 2006 3,567 3,586 2007 3,558 6,914 Gen- eration F1 2008 F2 3,599 5,203 Number Released Autumn Standard 170K 373K 277K 308K 221K 258K 140K 345K 129K 241K F1 F1 F1
SLIDE 11
Average Smolt Length and Condition Factor Brood Years 2004-07
Fork l len ength (m (mm)
Autumn Line, X = 213.6 Standard stock, X = 212.0
Conditi tion Facto tor
PERCENT OF TOTAL
Autumn Line, X = 1.03 Standard stock, X = 1.06 5 10 15 20 25 120 140 160 180 200 220 240 260 280 5 10 15 20 25 0.80 0.90 1.00 1.10 1.20 1.30 1.40
SLIDE 12
Survival (± CI) Aut umn St andard
2004 77 (2.1) 77 (3.0) 2005 73 (6.6) 74 (5.3) 2006 71 (22.3) 78 (41.0) 2007 84 (19.3) 84 (13.5) 77% 79% Averages 23.5 (7.0) 21.6 (11.5) 30.8 (6.7) 31.3 (11.3)
Autumn Standard
23.8 (7.6) 22.4 (10.8) 30.1 (8.7) 33.1 (12.9)
Brood Year % Outmigration Travel Time (d; ± SD)
Juvenile Performance
2008 82 (4.8) 80 (3.9) 18.3 (9.7) 17.3 (11.2) 25.1 25.3
SLIDE 13 Average Adult Steelhead Return Timing
McNary Lower Granite
MONTH TH PERCEN ENT R RECOVER ERED ED
Bonneville AUTUMN LINE STANDARD STOCK
Average Adult Steelhead Return Timing
F1 Generation, (BY 2004-07)
5 10 15 20 25
5 10 15 20 25 5 10 15 20 25 June July Aug Sept Oct Nov Dec
- Aug. 5
- Aug. 14
- Aug. 31
- Sept. 24
- Sept. 11
- Oct. 6
SLIDE 14
McNary Lower Granite
MONTH PERCEN ENT R RECOVER ERED ED
Bonneville AUTUMN LINE STANDARD STOCK
F2 Generation Adult Return Timing
BY 2008-11
June July Aug Sept Oct Nov Dec 5 10 15 20 25 5 10 15 20 25 5 10 15 20 25
SLIDE 15 Smol Smolt-to to-Adul ult Sur Survival t to
Dam
BRO BROOD Y YEAR AR PER PERCENT SU SURVIVAL
Autumn line, F1 generation Standard stock Autumn line, F2 generation
(F1 28% difference, significant, P = 0.004)
1 2 3 4 5 6 7 2004 2005 2006 2007 2008 2009 2010
One-Ocean Returns
SLIDE 16 BRO BROOD Y YEAR AR
Smol Smolt-to to-Adul ult Sur Survival t to
Lower G Grani nite D Dam
(F1 significantly different, P < 0.001) PER PERCENT SU SURVIVAL
Autumn line, F1 generation Standard stock
0.5 1 1.5 2 2.5 3 3.5 4 2004 2005 2006 2007 2008 2009 2010
Autumn line, F2 generation
One-Ocean Returns
SLIDE 17 Smol Smolt-to to-Adul ult Sur Survival Comp
PI PIT T TAG D G DER ERIVED ED CWT D DER ERIVED ED Brood Autumn Standard Autumn Standard Year Line Stock Line Stock 2004 1.8 1.3 1.4 1.1 2005 1.9 1.7 3.7 1.6 2006 1.8 1.3 1.2 1.0 2007 5.9 4.7 3.4 3.3 Mean = 2.9 2.3 2.4 1.8
SLIDE 18
2004 2005 2006 2007
BRO BROOD Y YEAR AR % 1 % 1-OCE CEAN A N ADUL ULTS TS
Age At Return
Standard stock Autumn line, F1 generation
20 40 60 80 100
2008 2009 Autumn line, F2 generation
SLIDE 19 % STR TRAY R RATE TE I INDE NDEX BRO BROOD Y YEAR AR
Percen ent o
Steel eelhead ad t that S Strayed
Autumn line, F1 generation Standard stock
And d th the P Perce cent o
Bar arged Fi Fish
5 10 15 20
2004 2005 2006 2007 2008
239 113 46 51 66 41 171 95 23 57
94.0% 76.0% 47.0% 41.0% 46.0%
Autumn line, F2 generation
SLIDE 20 20 20 40
Kilometers
Mouth (RK 0) Pelton Trap (RK 161) Sherars Falls (RK 69) Warm Springs National Fish Hatchery (RK 154)
COLU LUMBIA R RIVER ER
Deschutes River Basin
>90% o 90% of W Wal allowa s a sto tock str trays ar are e in D Des eschutes es ~85% o 85% of s str tray f from above Shera rars rs Fa Falls
SLIDE 21
Run Year Experimental Group Number Detected at Sherars Falls Number Later Detected at McNary or Above Percent Later Detected at McNary or Above 2007-08 Autumn Line 5 Standard Stock 7 5 71 2008-09 Autumn Line 6 1 17 Standard Stock 3 2009-10 Autumn Line 19 4 21 Standard Stock 15 2 13 2010-11 Autumn Line 5 2 40 Standard Stock 5 Total Autumn Line 35 7 20 Total Standard Stock 30 7 23
PIT Tag Detections in Deschutes and at McNary
SLIDE 22 Compens nsation P
Fishe herie ies
SLIDE 23 5 10 15 20 25 30 35 40 Sept Oct Nov Dec Jan Feb Feb Mar Apr
PER PERCENT OF OF TOTAL H HARVES EST
Lower G er Grande R e Ronde Autumn line Standard stock
85 554 451 106 138 718 87
Harvest st T Timing i in the G e Grande R Ronde Basi sin
MONTH TH
Wallowa
(run years 2006-07 to 2010-11)
88 681
SLIDE 24 Sept Oct Nov Dec Jan Feb Mar April
MONTH TH
Autumn line, X = 9.4 Standard stock, X = 8.0
Harvest in the Compensation Area
Error bars = 1 SE
HARVEST ESTED ED / /1,000 S SMOLTS
0.0 0.5 1.0 1.5 2.0 2.5 3.0 3.5 4.0 4.5
SLIDE 25 Conc
- nclusion
- ns
- Autumn Line F1 adults pass Lower Granite Dam
earlier, provide increased autumn fishing
- pportunities in Grande Ronde River.
- Will F2 and subsequent generations continue to return
earlier?
- Greater Autumn Line survival to adulthood.
- Is it just because they return at an earlier ocean age?
- Will the trend continue?
- No apparent straying benefit to Autumn Line.
- Will stray rates remain low for all release groups?
- Are there other broodstock, rearing, or release strategies
that can be used to reduce straying.
SLIDE 26 Fut Futur ure Pl Plans ns f for
he A Aut utumn Li n Line ne
- 1. Brood Year 2012: Increase smolt production to 240,000 smolts (30% of
entire Wallowa stock production). Maintain current marking and tagging to assess whether F3 generation performs similarly to F1 generation.
- 2. Brood Year 2013 and beyond: Increase Autumn Line production to
320,000 smolts in BY 2013, 400,000 smolts in BY 2014.
- Releasing both lines would benefit autumn and spring fishing periods,
provided future generations perform similarly to the F1 generation.
- Autumn Line may require occasional refreshing with new broodstock
collected via angling in the Grande Ronde in autumn.
- During this time, straying information from F1 and F2 generations will
continue to be collected and assessed.
- The ability of the hatchery to concurrently spawn, rear, and release
Autumn Line and standard production groups (each consisting of 400,000 smolts) will impact future decisions.
SLIDE 27 Acknow
ledgeme ments
- Many thanks to the 192 anglers and
volunteers for:
– 7,000 hours – 111,000 miles of travel – 2500 meals served
- ODFW Wallowa Hatchery and NE Region fish
liberation staff
- Rick Madigan – Wenaha Wildlife Area
- Volunteers from local state and tribal
agencies